


If you trade XAG/USD, silver CFDs, silver futures, or silver ETFs, here’s a deeper dive into what moved silver this week and what to watch going into next week.
Silver dropped nearly 10% this week. One report did most of the damage. But the setup for it was being built all week long.
The Week in Review
The week opened with geopolitical risk and closed with a macro sledgehammer. What started as an oil-shock story ended as a Fed-hike story.
Monday
Silver opened the week near $75.29, carrying over last week’s flat close, and initially held steady. Then the geopolitical floor shifted under it.
Reports confirmed the U.S. conducted strikes on Iranian facilities over the weekend. Iranian Revolutionary Guards retaliated by targeting a U.S. military base.
Ceasefire talks, which had been inching toward a 60-day extension, appeared to collapse.
Strait of Hormuz risk back on the table → oil prices spiked → inflation expectations climbed → higher-for-longer rate bets firmed up → silver sold off.
Brent crude surged more than 4% on Monday, touching approximately $95 per barrel. Silver closed near $74.50, giving up gains from the prior week’s recovery attempt.
Tuesday and Wednesday
Silver traded in a tight range through Tuesday and Wednesday as traders waited for more clarity on both the Iran situation and the upcoming jobs data.
Oil pulled back modestly as the immediate exchange of strikes appeared to pause. That took some pressure off inflation expectations in the short term.
Silver consolidated around $74 to $75, but it never reclaimed the 50 SMA at $76.15.
That failure to reclaim the 50 SMA told you the bulls could not hold the level even on a quiet day.
Thursday
Silver pushed toward $77.01 on Thursday, its weekly high, as some traders positioned for a softer jobs print.
Silver closed at $73.89. Back below the 50 SMA.
Friday
The May nonfarm payrolls report dropped at 8:30 AM ET on June 5.
The U.S. economy added 172,000 jobs, more than double the top of consensus estimates.
172,000 jobs → third consecutive upside surprise in NFP → the labor market is not breaking → the Fed has no reason to cut → traders repriced higher probability of a rate hike → the dollar rallied → real yields jumped → silver got hammered.
Silver fell approximately 8% on Friday alone, closing at $67.78. That was also its weekly low, touched intraday at $67.57.
The Gold/Silver Ratio Widened.
Gold also fell hard this week, dropping roughly 4.6% to close near $4,328. But silver fell nearly 10%.
The gold/silver ratio, which measures how many ounces of silver it takes to buy one ounce of gold, widened to approximately 63.7. That’s up from roughly 60.1 last week.
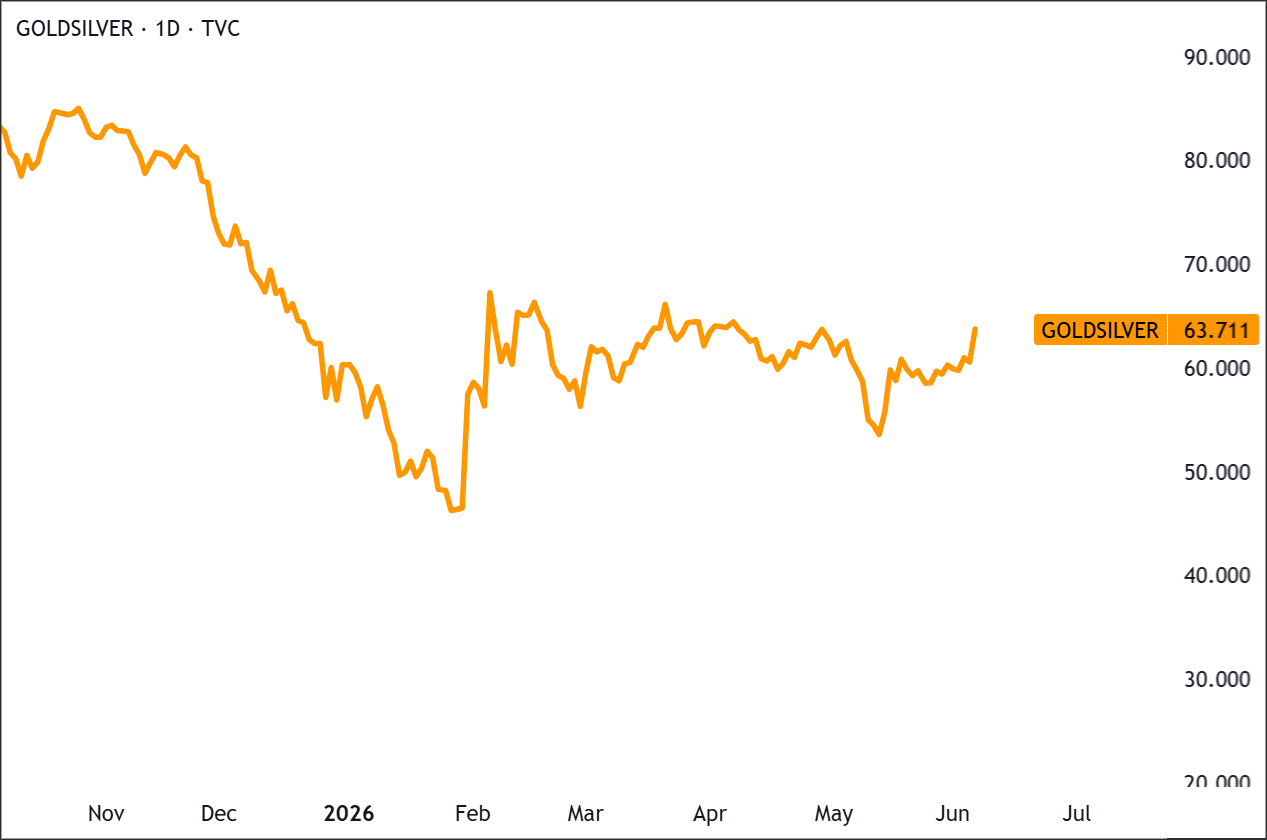
When the ratio widens, silver is underperforming gold.
Silver fell harder because it always does. It trades in a thinner, more speculative market than gold.
When rate expectations shift or growth fears creep in, silver moves faster and further than gold. Both up and down.
Gold is the safe haven. Silver is the louder, more volatile version of that trade.
What the Big Funds Were Doing.
The COMEX managed money data for silver, which captures hedge funds and other institutional futures traders, showed a net long of 10,444 contracts as of June 2, up from 10,055 the prior week.
Funds were net long silver going into Friday, but positioning was not extended by historical standards.
When NFP hit and the macro surprise went the other way, those longs were on the wrong side.
Longs being cut or stopped out add selling on top of the initial shock, which increases downside pressure and speeds up the move.
But this was not a crowded silver long that had to be force‑liquidated. In a truly crowded market, an unwind can turn a normal selloff into a cascade.
Here, the move was primarily macro‑driven, and positioning acted as an amplifier rather than the main cause.
Technical Backdrop
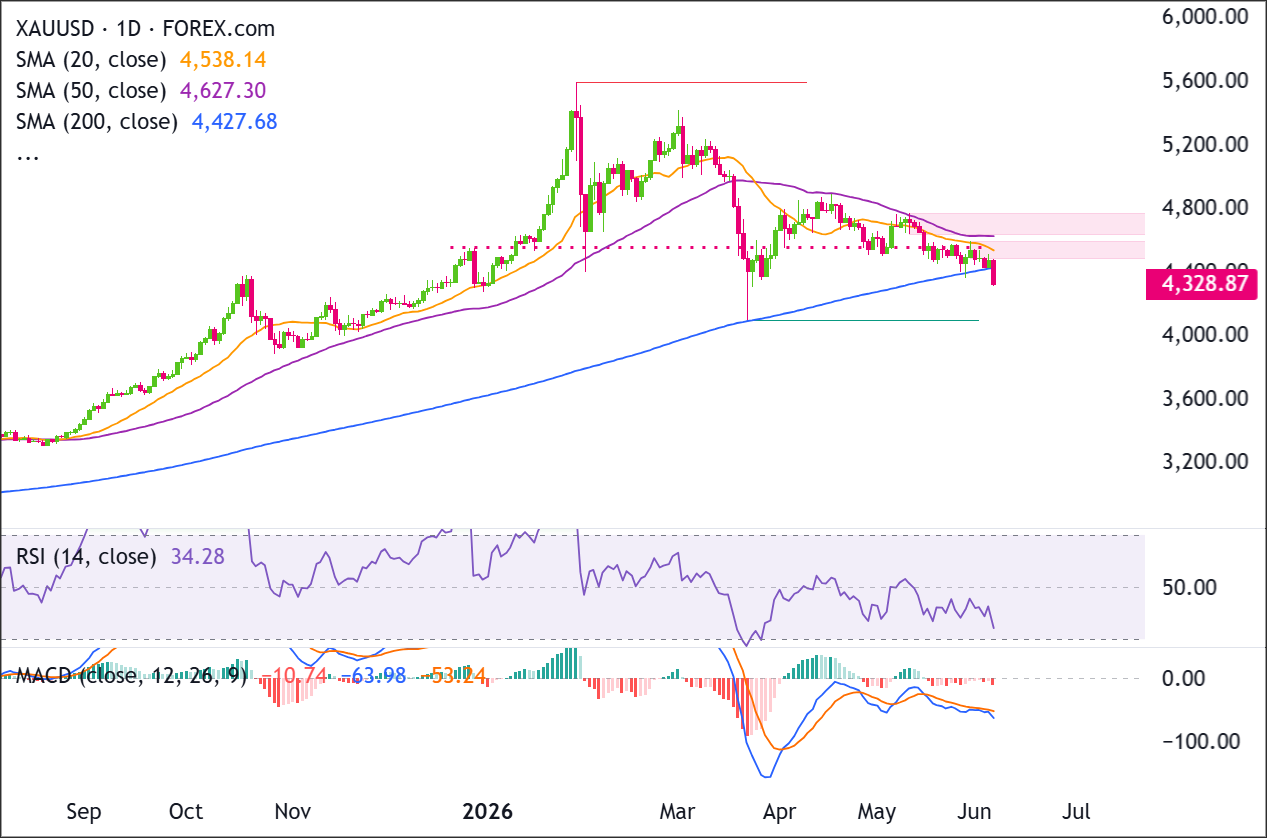
Recent Price Action
Recent price action shows sellers taking control after repeated failure near 75.50-78.00.
The latest move pushed price sharply into the 67.60-68.00 support area, where buyers need to defend the 200-day SMA.
A recovery above 78.00 would shift momentum back toward buyers, while a daily close below 67.00 would confirm a deeper breakdown toward 60.00-62.00.
Moving Averages
The 200 SMA sits at $67.621. This is the structural trend floor, the level that defines whether the long-term bull market is still intact. Silver closed at $67.78 on Friday, just 16 cents above it. The 200 SMA held, but barely.
The 50 SMA sits at $76.157. Silver was rejected by this level on Thursday’s high and then collapsed through it on Friday. What was resistance on the way down is now a meaningful hurdle to reclaim.
The 20 SMA sits at $77.211, above the 50 SMA. That stacks short-term resistance directly overhead from $76.16 to $77.21. Getting back above both of those requires sustained buying pressure that the current macro conditions don’t support.
Momentum
RSI (14-day) reads 35.28. It dropped sharply this week and is now sitting just above oversold territory.
A bounce is mechanically possible from here. But oversold conditions can persist in a strong downtrend, and nothing on the RSI yet signals exhaustion. It’s approaching the floor, not bouncing off it.
MACD reads -1.473 (MACD line) against a signal line of -0.654, with a histogram of -0.819. The MACD line is below the signal line. That is a bearish crossover.
The histogram is negative, meaning downward momentum has not reversed. Watch whether it starts to narrow next week. If it does, that is the first technical sign the selling is losing steam.
Key Support and Resistance Levels
Here are the levels worth having on your screen going into next week.
| Level Type | Price Zone | Technical Significance |
|---|---|---|
| Major Resistance | $88 to $90 | May spike zone and failed recovery shelf |
| Secondary Resistance | $80 to $82 | Prior rejection zone above all three short-term averages |
| Immediate Resistance | $76.16 to $77.21 | 50 SMA and 20 SMA stacked overhead after Friday’s collapse |
| Immediate Support | $67.57 to $67.78 | Friday’s intraday low and close; the line that held this week |
| Major Support | $63 to $65 | Next meaningful demand zone if the 200 SMA breaks |
| Structural Floor | $67.621 | 200 SMA; the long-term bull market floor |
Current Market Conditions at a Glance
Everything we just covered, in one place.
| Indicator | Reading | What It’s Telling You |
|---|---|---|
| XAG/USD Close | ~$67.78 | Bearish. Silver dropped nearly 10% in a single week and closed just above the 200 SMA. |
| Distance from ATH ($121.67) | ~44% below | Deep correction. The January peak is now almost half-price away. |
| 200 SMA | $67.621 | Critical. Silver closed $0.16 above the structural floor. The long-term trend is intact but being tested directly. |
| 50 SMA | $76.157 | Bearish. Price collapsed below this level on Friday. It is now the first major overhead obstacle. |
| RSI (14-day) | 35.28 | Nearing oversold. A mechanical bounce is possible, but oversold conditions can persist in a strong downtrend. |
| MACD | Bearish crossover. MACD line below signal line. Histogram negative. | Momentum is still pointing down. The histogram narrowing is an early signal to watch, not a confirmation. |
| Gold/Silver Ratio | ~63.7 | Silver underperforming. The ratio widened sharply this week as silver fell twice as hard as gold. |
| Managed Money Positioning | Net long 10,444 contracts as of June 2 | Specs were leaning long into the NFP shock. Friday’s collapse forced liquidation. Position is not crowded, which limits cascade risk. |
| Brent Crude | ~$91/bbl | Elevated. Oil spiked early week on Iran strike news, then pulled back. Brent above $90 keeps inflation pressure in the background. |
| Fed Rate Expectations | ~70% chance of at least one hike by year-end (CME FedWatch) | Hawkish. The NFP print pushed rate-hike bets from 45% to ~70% in a single day. This is now the dominant macro headwind. |
| Next Key Event | May CPI, June 10 | High swing risk. A hot print confirms the hike narrative and puts the 200 SMA in serious danger. A cool print gives bulls their first real relief since April. |
The Big Thing to Watch
May CPI drops Wednesday, June 10, at 8:30 AM ET.
This is the most important data point silver faces next week. CPI will tell it whether prices are actually rising fast enough to justify a rate hike.
A hot CPI print, headline above 3.5% or core above 3.2%, confirms the inflation-plus-strong-jobs combo that makes a hike unavoidable.
That scenario puts the 200 SMA at $67.621 under direct pressure. A break below it would be a structural signal.
A cool CPI print, particularly if core comes in below 3.0%, gives silver a reason to stabilize.
It wouldn’t undo the NFP damage, but it would reduce the urgency of a hike. Watch for a bounce toward $70 to $72 in that scenario.
Silver’s direction next week hinges on a single CPI print and whether inflation is running hot enough to make a rate hike unavoidable. If the inflation-to-central-bank connection is unfamiliar, Premium members can read our lesson:
📖 Inflation: The Force That Moves Central Banks
Reading this helps you understand how CPI and core inflation are measured, why central banks respond differently to each inflation regime, and how those policy shifts flow through to asset prices like silver.
And if you’re not a Premium subscriber yet, now’s a good time to sign up.
With Babypips Premium, you get full access to School of Pipsology lessons that help you understand not just the number on the calendar, but the central bank mechanics and inflation regimes that determine what happens to prices after the release.
The U.S.-Iran situation is the secondary risk.
Talks appear broken down after this week’s strike exchange. If the Strait of Hormuz closure moves back to the front pages, Brent above $95 brings inflation fears back with it.
Key Levels to Watch
If you’re looking to go long, the only defensible level right now is a confirmed hold of the 200 SMA. That means a close at or above $67.78 again on Monday, then Tuesday. Buying into a potential 200 SMA break is a high-risk entry. Wait for the level to prove itself before committing.
If you’re already long, watch the 200 SMA at $67.621 as your line in the sand. A daily close below it is a structural break. That changes the picture meaningfully. Consider sizing down now and reloading only after the CPI reaction is clear.
If you’re looking to go short, the cleanest entry is a failed bounce at the 50 SMA ($76.157) or a confirmed break of the 200 SMA on a daily close. A break below $67.57, Friday’s intraday low, that holds on a retest puts $63 to $65 in view.
If you’re already short, the RSI at 35 means you are approaching territory where covering into weakness makes sense. The 200 SMA has held as a floor in this bull market. Watch the reaction to it. Consider trimming into any test of $67.57 that fails.
Bottom Line
Silver went from testing resistance at the 50 SMA to testing support at the 200 SMA in five trading days.
One Report, One Structural Test
The May jobs print didn’t just take silver down 10%. It changed what the market is pricing for the rest of the year.
Rate hike odds went from 45% to ~70% in a single session. The Fed’s posture shifted from neutral to potentially hawkish.
The 200 SMA is the only thing standing between this correction and a structural breakdown of the bull trend that has been intact since 2024.
The One Thing to Watch
May CPI on June 10.
Hot print: 200 SMA breaks, next support at $63 to $65, do not add.
Cool print: first stabilization signal since April, watch for a bounce into $70 to $72 before deciding anything.
The bull market structure is still technically intact. The 200 SMA held. Barely.


