





If you trade XAG/USD, silver CFDs, silver futures, or silver ETFs, here is a closer look at what moved silver this week and what to watch next week.
Silver moved back and forth around the 50 SMA all week and finished almost exactly where it started.
The Week in Review
The two biggest events this week were the reported U.S.-Iran ceasefire framework and the April PCE inflation report.
Monday
Silver opened near $76.54 and climbed as high as $78.82 before closing at $78.08. That was its strongest close of the week.
Reports pointed to a possible U.S.-Iran framework based on a 60-day ceasefire extension, a reopening of the Strait of Hormuz, and follow-up nuclear talks.
Deal hopes → less extra oil-price pressure from Hormuz → a calmer inflation backdrop → silver caught a bid.
The move pushed silver back above the 50 SMA.
Tuesday
Silver gave back part of Monday’s gain and closed near $76.98. Price was still above the 50 SMA, but the move higher was already losing momentum.
Crude oil stayed active as traders tried to figure out the difference between a proposed framework and a deal that could actually be enforced.
A confirmed Hormuz reopening would ease oil pressure. A failed deal would bring that pressure back.
Wednesday
Wednesday was the first real test. Silver closed near $74.68, down about 3% on the day and back below the 50 SMA.
The ceasefire headlines reduced some of the extra oil-price pressure tied to Hormuz, but they didn’t fix the Fed problem.
Higher-for-longer rate expectations → a firmer dollar and stronger bond demand → a higher opportunity cost for owning non-yielding assets → silver sold off.
That remains the main risk. Oil can affect the inflation backdrop, but Fed expectations still decide whether silver gets room to breathe.
Thursday
Silver tested $71.79 intraday, then recovered and closed near $75.65.
The April PCE report helped silver in the short term because the monthly inflation numbers were cooler than expected.
Headline PCE rose 0.4% month over month versus 0.5% expected. Core PCE rose 0.2% versus 0.3% expected.
Cooler-than-expected monthly inflation → less immediate rate pressure → silver bounced.
Friday
Silver closed near $75.29, almost flat on the week and still below the 50 SMA.
The U.S.-Iran ceasefire talks remained a key focus. Reports pointed to progress on a 60-day ceasefire extension and a possible reopening of the Strait of Hormuz, but Iranian officials disputed parts of the U.S. account.
That helped keep oil prices lower.
Brent closed near ~$91, down about ~11.% from the prior Friday’s close.
Brent matters because it reflects global shipping risk tied to Hormuz.
Gold closed near $4,540, up about 0.7% on the week.
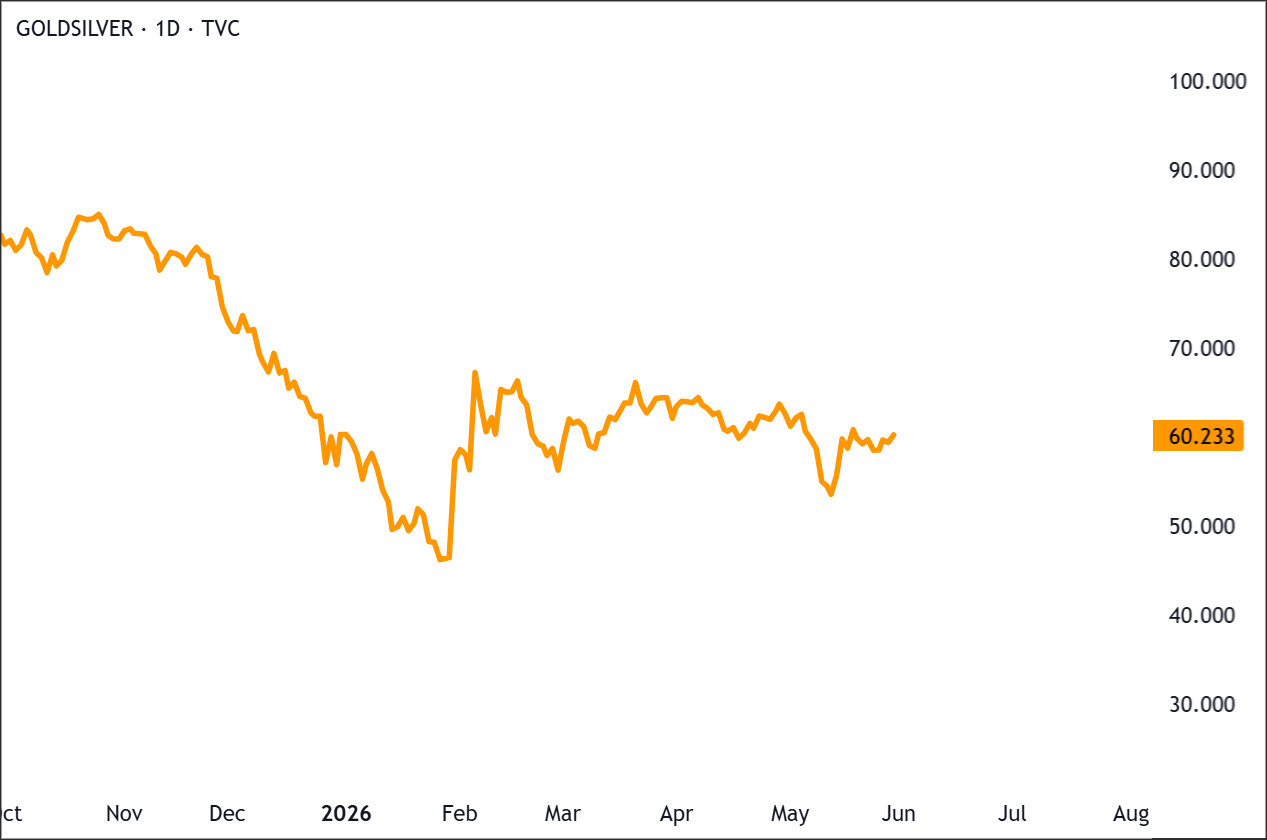
The gold/silver ratio, which shows how many ounces of silver it takes to buy one ounce of gold, widened from roughly 59.7 to 60.1. That means silver lagged gold into the close.
The CFTC disaggregated silver report showed Managed Money, which includes hedge funds and other large speculative traders, long 16,670 contracts and short 6,615 contracts as of May 26.
That left Managed Money net long 10,055 contracts, down 1,509 from the prior week.
Managed Money was still net long silver, but the position was not crowded. That lowers liquidation risk, but it also shows large speculative traders were not aggressively chasing upside.
Technical Backdrop
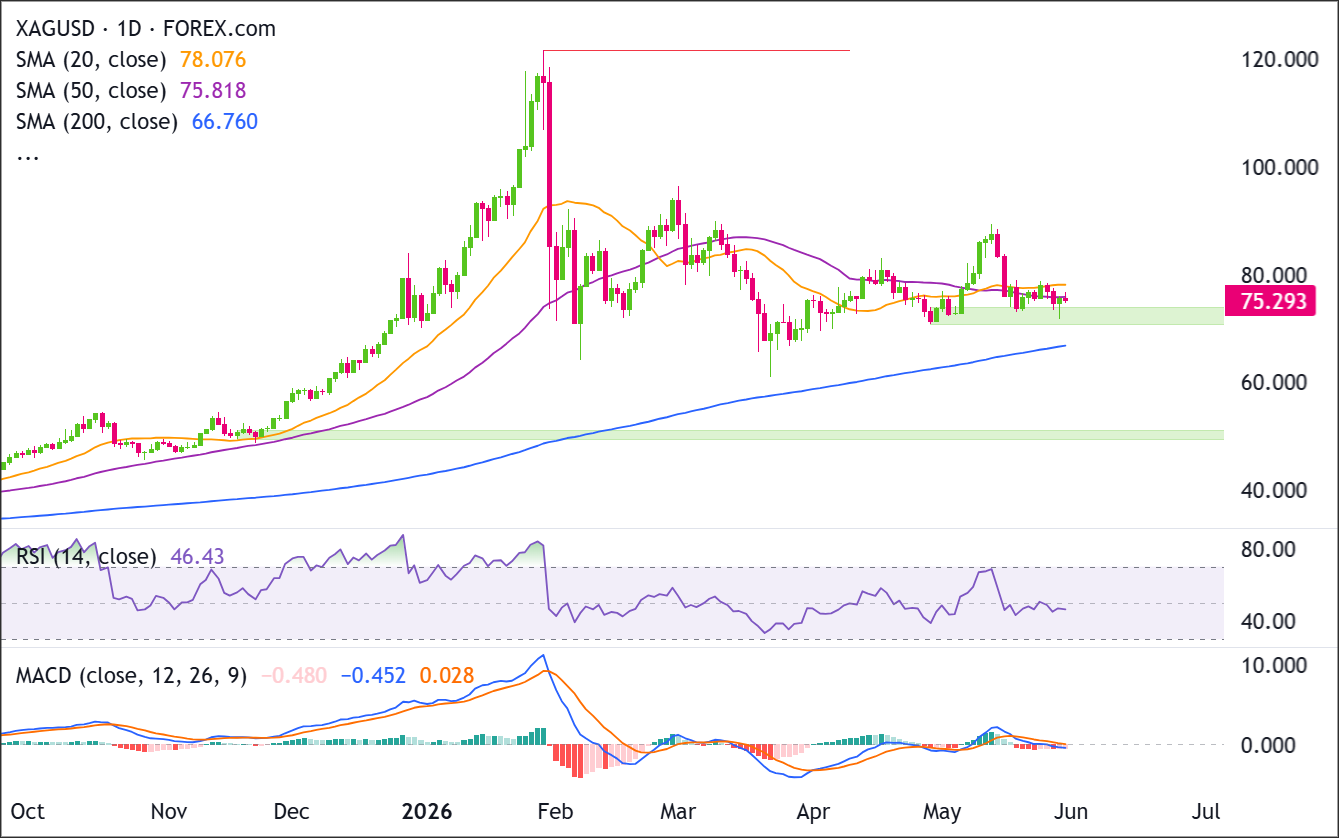
Here’s what the chart shows now.
Recent Price Action
Recent price action show compression around 75.00–78.00 after sellers rejected the prior rally into 88.00–90.00.
Buyers are trying to defend the green support zone around 71.00–75.00, but momentum is not yet clearly bullish while price remains below 78.00–80.00.
Moving Averages
The 200 SMA sits at $66.760. The long-term bull-market floor was never threatened this week.
The 50 SMA sits at $75.818. Silver closed below it again. That makes the 50 SMA the key level to watch next week.
The 20 SMA sits at $78.076, above the 50 SMA. That puts short-term resistance directly overhead from roughly $75.82 to $78.08.
Momentum
RSI is at 46.. That is neutral to slightly weak, not oversold. Bulls do not have a strong exhaustion signal to lean on yet.
MACD remains in a bearish crossover, with the MACD line below the signal line. The histogram is negative, but the latest bars are less negative than the mid-May low. Momentum is still bearish, but it’s not getting worse right now.
Key Support & Resistance Levels
Here are the levels worth having on your screen heading into next week.
| Level Type | Price Zone | Technical Significance |
|---|---|---|
| Major Resistance | $88 to $90 | May spike zone and failed recovery shelf |
| Secondary Resistance | $80 to $82 | Prior rejection zone above the short-term averages |
| Immediate Resistance | $75.82 to $78.08 | 50 SMA and 20 SMA stacked directly above price |
| Immediate Support | $74.59 to $75.00 | Friday low zone and weekly close support |
| Major Support | $71.81 to $72.00 | Thursday low and last defense before deeper damage |
| Structural Floor | $66.760 | 200 SMA; the long-term bull market floor |
Current Market Conditions at a Glance
Everything covered, in one place.
| Indicator | Reading | What It’s Telling You |
|---|---|---|
| XAG/USD Close | ~$75.29 | Flat on the week. Price failed to reclaim the 50 SMA. |
| Distance from ATH ($121.67) | ~38% below | Deep correction. January’s top still controls the chart. |
| 200 SMA | $66.76 | Bull trend intact. Structural support sits far below price. |
| 50 SMA | $75.81 | Near-term bearish. Price closed below the key level again. |
| RSI (14-day) | 46 | Neutral to soft. There is room to fall before oversold. |
| MACD | Bearish crossover | Caution signal. Momentum is negative but not accelerating. |
| Gold/Silver Ratio | ~60 | Silver lagged gold. Relative strength did not confirm upside. |
| Managed Money Positioning | Net long 10,055 contracts | Specs remain long but not crowded. They reduced net length on the week. |
| Brent Crude | ~$91/bbl | Secondary input. Brent mattered because the Iran framework targeted Hormuz and global shipping risk. |
| Fed Rate Hike Odds (year-end) | 48% | Mildly bullish. Ceasefire progress and softer monthly PCE trimmed hike bets |
| Next Key Event | May Employment Situation, June 5 | Big swing risk. Jobs and wages can quickly reprice the Fed path. |
The Big Thing to Watch
The May U.S. jobs report comes out Friday, June 5, at 8:30 AM ET.
Traders will use it to judge whether the Fed can stay on hold, or whether strong hiring and wage growth could push officials toward a more hawkish stance, including renewed talk of rate hikes.
A strong payrolls number with hot wages keeps rate-hike risk alive and puts $74.59, then $71.81 to $72.00, back in play.
A softer jobs print with cooler wages gives silver a cleaner chance to reclaim the 50 SMA. A close back above $75.818 is step one. A move through $78.076 would be stronger confirmation.
The U.S.-Iran ceasefire talks remain the key geopolitical risk. A confirmed Hormuz reopening would keep global oil-shock concerns lower.
A breakdown in talks brings that pressure back quickly.
Friday’s jobs report could shift Fed rate expectations and move silver prices in either direction, and if the pre-event positioning framework isn’t familiar territory, Premium members can read our lesson:
📖 Pre-Positioning: Build Your Trade Before the Data Print
Reading this helps you understand pre-news bias, event risk management around major releases, and how to trade the outcome instead of chasing the initial price spike.
And if you’re not a Premium subscriber yet, now’s a good time to sign up.
With Babypips Premium, you get full access to School of Pipsology lessons that help you understand not just what the key price levels are, but the macro dynamics behind major data releases and how to build a directional trade plan before the number drops.
Key Levels to Watch
If you’re looking to go long, wait for a close above the 50 SMA at $75.81 or a drop into $72 to $74 that holds. Buying in the middle of the range means trading chop instead of waiting for confirmation.
If you’re already long, watch $75.81 closely. A strong close above it improves the setup. A rejection there is a reason to trim.
If you’re looking to go short, the cleaner setup is a failed reclaim (strong rejection) at the 50 SMA or a break below $74.59 that holds. The next downside zone is $71.81 to $72.00.
If you’re already short, don’t ignore the Thursday reversal. Price already showed that buyers will defend $72. A close back above $78 is your warning to cover or reduce.
Bottom Line
Silver ended the week nearly unchanged, but the chart still sent an important message.
Price recovered from Thursday’s weakness, then still closed below the 50 SMA.
That leaves silver stuck.
The 200 SMA shows the long-term uptrend is still intact, but the 50 SMA shows the short-term setup is still weak.



