





If you trade XAG/USD, silver CFDs, silver futures, or silver ETFs, here’s what moved silver this week and what to watch next week.
The Week in Review
Let’s review what happened to silver this week.
Monday: A Quiet Pause After Last Week’s Bounce
Silver closed at $62.05 (-0.52%) as US markets reopened after the July 4 holiday.
Last week’s soft June jobs report (57K vs. 113K expected) had cooled hike bets and lifted silver into the long weekend, and Monday’s session looked like traders taking profit on that move.
Tuesday: Oil Shock Hits Silver
The US revoked Iran’s oil waiver after tanker attacks in the Strait of Hormuz → Brent crude and Treasury yields jumped → the dollar firmed → silver closed at $59.97, down from Monday’s close.
Wednesday: Losses Deepen as Ceasefire Deal Collapses
President Trump declared the interim Iran ceasefire over → oil jumped more than 5% → rate-hike fears rebuilt → the dollar firmed again and silver dropped a third straight session, closing at $58.27.
Minutes from the June Fed meeting, showing the committee split 9-9 on whether another hike is needed this year, added to the pressure on precious metals.
Thursday: A Bounce
Oil pulled back from Wednesday’s spike → Treasury yields eased → the dollar softened → non-yielding assets faced less pressure → silver became more attractive to buyers.
Silver closed at $59.95, snapping a three-session losing streak, as traders bought the dip after Wednesday’s drop. It ended the day just under $60.
Friday: Consolidation, No Catalyst
Silver closed at $59.89, down $0.06 from Friday’s open of $59.955 (-0.11%). No clear catalyst drove the session, and silver consolidated just under $60.
The Gold/Silver Ratio
The gold/silver ratio, which measures how many ounces of silver it takes to buy one ounce of gold, widened this week from about 67.7 to roughly 68.8.
A widening ratio means silver underperformed gold, and that’s what happened: silver fell 2.9% while gold fell 1.5%.
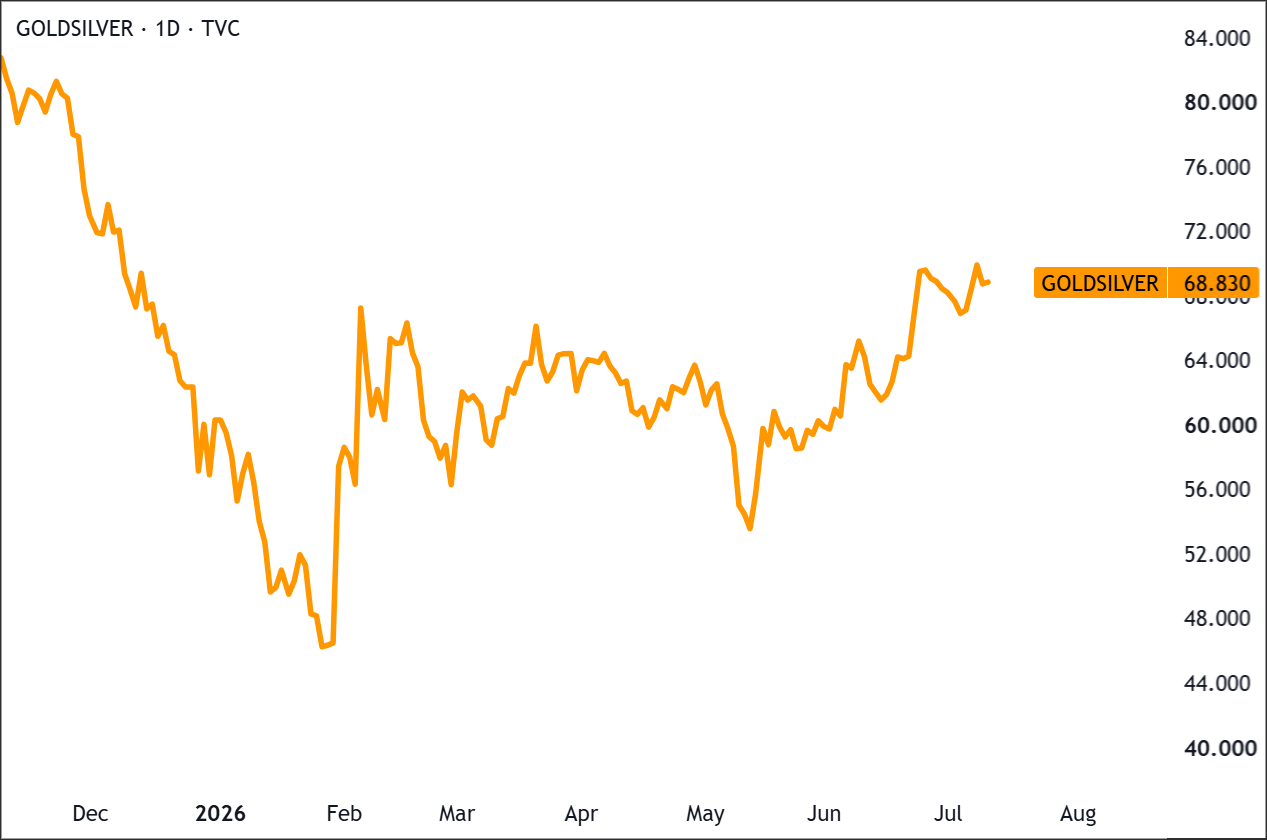
Gold and silver both sold off on the hawkish repricing, but silver moved harder in both directions. It trades in a thinner, more speculative market than gold, and its real industrial demand from solar, EVs, and electronics ties it to economic-cycle worries that gold doesn’t carry. When yields spike, silver falls harder.
The ratio has climbed from a low near 56 in May to roughly 68 now, meaning gold has reasserted its outperformance.
Managed Money Positioning
Managed money refers to large hedge funds and institutional traders who bet on silver futures.
The most recent CFTC report, reflecting positions as of Tuesday, July 7, showed these funds holding 19,294 long contracts and 6,093 short contracts, a net long of 13,201 contracts.
That’s up about 937 contracts from the week before, as funds added new longs and closed out some shorts.
That net long position is moderate, not an extreme long position. That matters because a crowded long position can amplify a selloff. With positioning this moderate, that risk is low right now.
This report only captures fund positions through Tuesday, so any changes funds made in reaction to Wednesday’s drop or Thursday’s rebound aren’t in this data yet.
Is Silver Entering a Higher Price Range?
Silver surged past $120 an ounce at the start of the year. By the second half of 2026, it had fallen roughly 40%, settling into the mid-$50s to mid-$60s range.
The question now is whether that range holds as the market’s new normal, or whether it’s just a stop on the way back down to pre-rally levels.
The bullish argument is straightforward. Silver may not go back to its old range.
After silver surged, the market corrected hard. That correction doesn’t mean the rally lacked real fundamentals behind it.
In commodity bull markets, prices often spike, pull back, and settle into a higher base.
Copper did something similar in past cycles. It corrected after major rallies, but it never fully returned to its old lows.
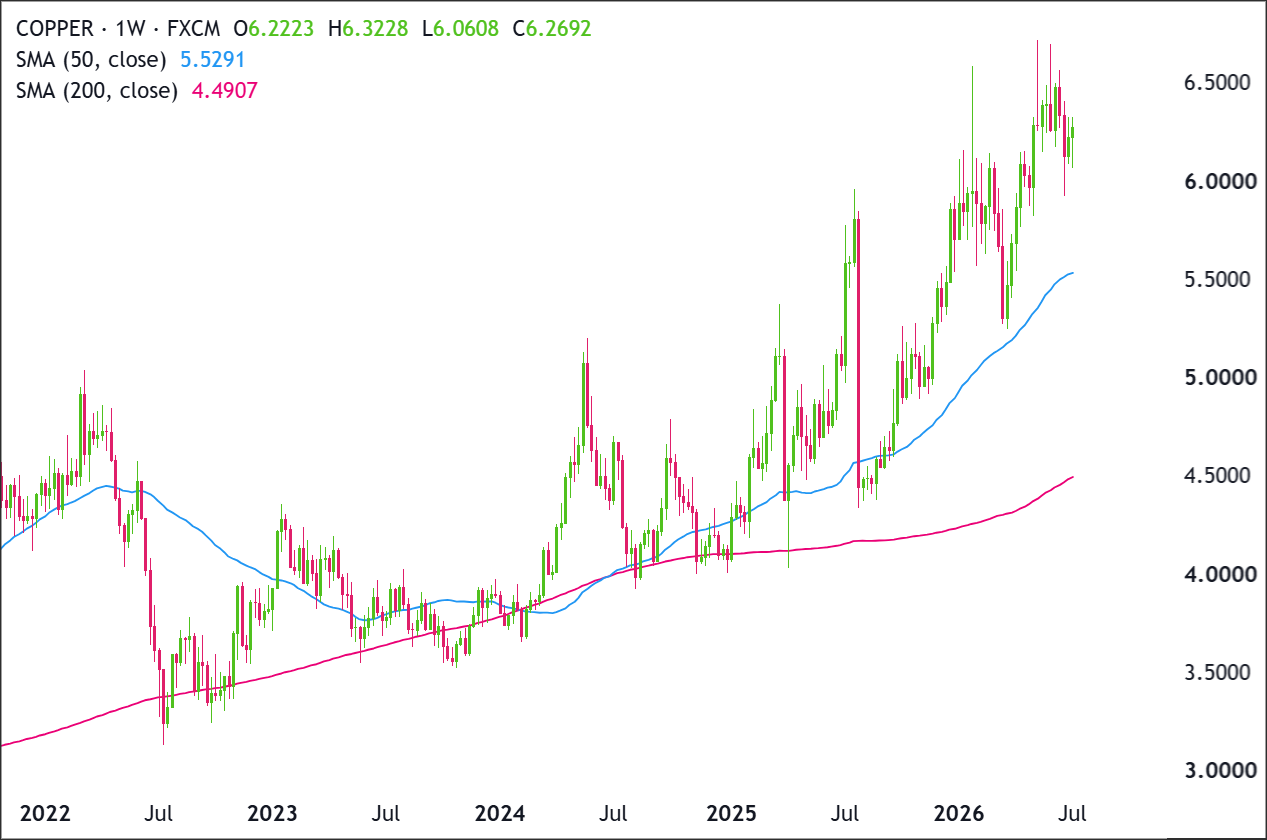
That may be the more useful lens for silver now. What holds a higher base in place comes down to demand.
Physical Demand Is the Key Issue
Silver isn’t just a precious metal trade. It’s used across electronics, solar panels, electric vehicles, appliances, phones, computers, AI infrastructure, and robotics.
Demand keeps growing. Mine supply has struggled to expand, and that gap is where the real risk sits.
Supply Can’t Respond Quickly
If physical demand stays strong and miners can’t ramp up production fast, higher prices may be needed for longer.
Even a big rally doesn’t create new supply overnight. New mines take years to permit, finance, build, and bring into production.
Major refining and exporting nations, notably China, have implemented strict export restrictions to secure silver for their own rapidly growing technology and green energy infrastructure, further reducing the global physical supply.
Silver may stay volatile, but the long-term structure could still be bullish. That tightness in the physical market becomes even more important once you factor in how silver trades.
The Paper Market Adds Fuel
A huge amount of silver trades through futures and other paper contracts. The amount of available physical metal is much smaller.
When physical buyers ask for actual metal instead of holding paper contracts, available supply can shrink fast.
If there isn’t enough physical silver to meet that demand, traders holding short positions may rush to buy silver to cover their obligations. That buying pressure can push prices up faster than usual.
None of this guarantees a smooth ride higher.
Don’t Confuse a Bullish Setup With a Straight Line
Silver can correct hard, especially after a crowded rally.
Margin changes, short-term positioning, dollar strength, weak industrial data, or profit-taking can all trigger sharp pullbacks.
None of that means buy every dip blindly. It means separating short-term noise from the shift underway underneath it.
Rethinking What “Expensive” Means
Silver may now be trading from a higher starting point. Silver traded below $30 an ounce as recently as last year.
If the market comes to treat the mid-$50s to mid-$60s as the new normal instead of a temporary spike, that reshapes what counts as “expensive.”
Silver remains a volatile market. But if physical demand keeps rising while supply stays slow to respond, the bigger risk is assuming yesterday’s price ranges still apply.
Technical Backdrop
Price Action
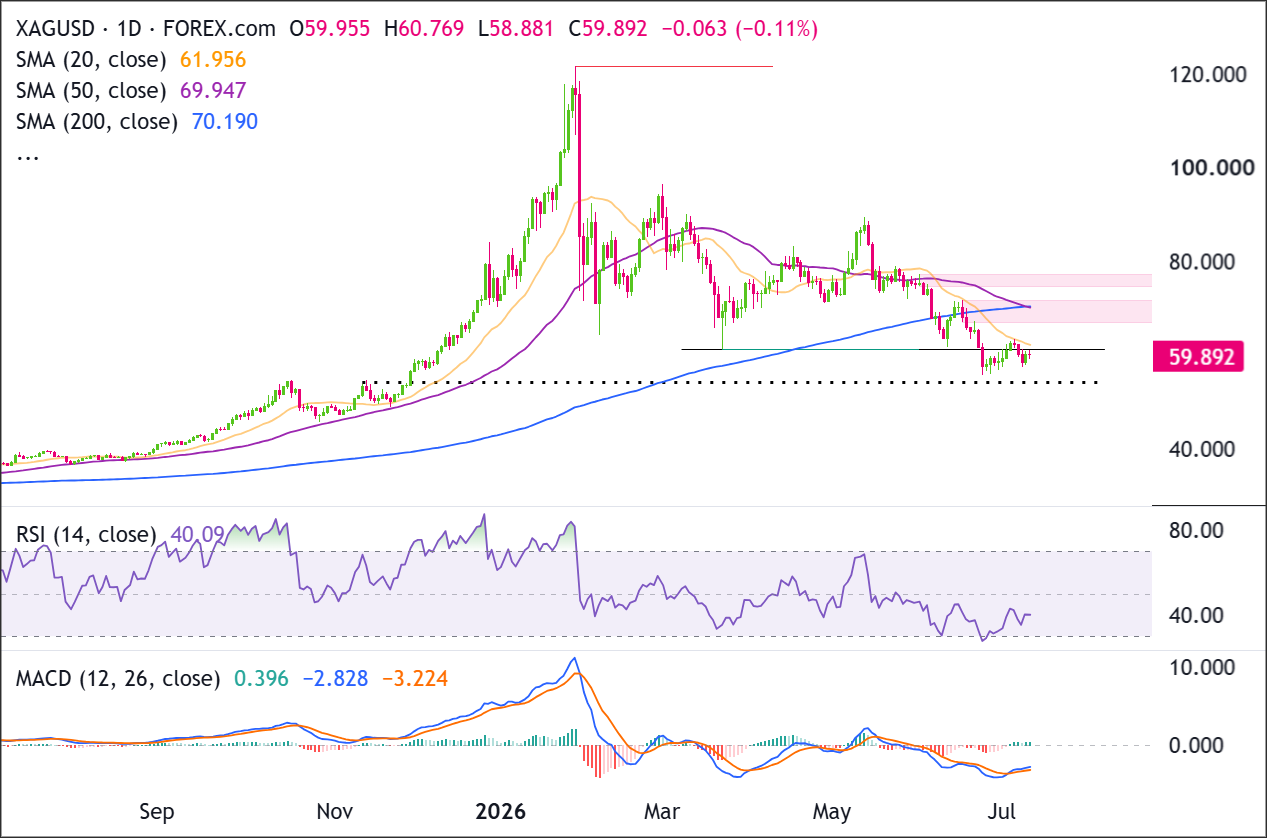
Price is consolidating beneath 61.30–62.00 after rebounding from the recent low near 56.00, but the recovery has not yet produced a convincing higher high.
Recent candles show repeated hesitation around 60.00–61.00, suggesting buyers are struggling to extend the rebound while sellers continue to defend overhead resistance.
A daily close above 62.00 would confirm that buyers have broken the immediate lower-high structure and could support a move toward 69.95–70.20.
A decisive close below 56.00 would confirm that the recent base has failed and reopen downside toward 50.00–52.00.
Moving Averages
The 20 SMA is at ~$61.956, declining, and about $2.07 above Friday’s close. It’s the first level buyers need to close above to signal that short-term selling pressure is easing.
The 50 SMA is at ~$69.947, declining, and roughly $10.06 above Friday’s close. It just slipped below the 200 SMA, the death cross visible on the chart, and that confirms sellers are in control of the medium-term trend.
The 200 SMA is at ~$70.190, still rising but only slightly, about $10.30 above Friday’s close. Price closed below it back in June, so it’s now resistance to reclaim.
A close back above it would mean silver has reclaimed the long-term trend line it lost in June, the broadest structural level bulls need to take back before the long-term downtrend is even in question.
Momentum
RSI reads 40, below the neutral 50 line, meaning sellers still have the edge on momentum. It hasn’t reached the oversold threshold of 30 that flags exhausted selling, so there’s room for silver to fall further before the indicator signals sellers may be overextended.
MACD tells a slightly different story. The histogram turned positive this week after months in negative territory, as the MACD line crossed above the signal line. That’s a bullish crossover, meaning selling momentum is fading for now.
Key Support & Resistance Levels
Here’s where the chart says the next move could stall or accelerate.
| Level Type | Price Zone | Technical Significance |
|---|---|---|
| Major Resistance | $76-$79 | The shaded zone marks the Feb-May consolidation base. A broken floor now acts as overhead supply. |
| Secondary Resistance | ~$70 | Where the 50 SMA (~$69.947) and 200 SMA (~$70.190) now cluster after the death cross. Both need reclaiming to signal a trend change. |
| Immediate Resistance | ~$61.96 | The 20 SMA. The first hurdle for any near-term bounce. |
| Current Price | $59.89 | Friday’s close. |
| Immediate Support | $58.27 | Wednesday’s close, this week’s low. |
| Major Support | $55.60 | The most recent swing low. A close below it would put silver at fresh 2026 lows. |
| Psychological Support | $50 | Significant round number below $60. The next key level if $60 isn’t reclaimed. |
Current Market Conditions at a Glance
Everything we just covered, in one place.
| Indicator | Reading | What It’s Telling You |
|---|---|---|
| XAG/USD Close | $59.89 | Down 2.9% on the week. Tuesday and Wednesday’s Iran-linked oil spike outweighed Thursday’s partial rebound. |
| Distance from ATH ($121.67) | 50.8% below | Deep in correction territory. The January blow-off and the Fed’s hawkish shift are both still doing damage. |
| 200 SMA | ~$70.19 | Price closed below it in June. It’s resistance to reclaim, not a floor. |
| 50 SMA | ~$69.95 | Just crossed below the 200 SMA. A death cross confirming the medium-term downtrend. |
| RSI | 40 | Sellers still have the edge on momentum, but it hasn’t reached the oversold threshold of 30 that flags exhausted selling. |
| MACD | Bullish crossover forming | Histogram turned positive this week, meaning selling momentum is fading for now. |
| Gold/Silver Ratio | ~68.83 | Widened from about 67.7. Silver underperformed gold this week. |
| Managed Money Positioning | Net long 13,201 contracts (as of July 7) | Not stretched to an extreme, so a further drop is unlikely to trigger forced selling from a crowded long position. |
| Brent Crude | ~$76.00 | Up about 5% on the week on US-Iran tensions. The main driver of silver’s selloff and bounce. |
| Fed Rate Expectations | ~85% hike odds by year-end | Hawkish rate expectations are weighing on silver. That’s a headwind for a metal that pays no yield. |
| Next Key Event(s) | Iran/Hormuz (ongoing); June CPI, Tuesday, July 14 | Hormuz could move silver any session. CPI is the next scheduled catalyst. |
The Big Thing to Watch
Three things could drive silver next week: an unresolved geopolitical risk, and two scheduled events hitting back to back.
Iran and the Strait of Hormuz
Tensions between the US and Iran remain unresolved after Wednesday’s collapse of the interim ceasefire deal, and the Strait of Hormuz is still the main flashpoint.
Any further escalation could push oil higher again, and based on this week’s pattern, that could revive inflation expectations, rate-hike pressure, and dollar strength, all headwinds for silver.
A de-escalation could ease that same pressure instead.
June CPI
June CPI hits Tuesday, July 14, before the US open.
Market consensus expects headline inflation to cool to 3.9% year over year, down from May’s 4.2%.
A softer print would reduce expectations for rate hikes and could trigger a relief rally in silver. A hotter print would reinforce those expectations and likely extend this week’s selloff.
Warsh Faces Congress
Fed Chair Kevin Warsh delivers his first Humphrey-Hawkins testimony this week.
It’s the twice-a-year appearance before Congress where the Fed chair presents the central bank’s policy report and answers questions on rates and inflation.
Warsh appears before the House Financial Services Committee on Tuesday, July 14, and the Senate Banking Committee on Wednesday, July 15.
Watch his comments for clues on whether the Fed delivers its first hike of the year. Any shift in tone could move silver as much as the CPI print.
Key Levels to Watch
If you’re looking to go long, wait for a close back above the 20 SMA (~$61.96). That would mean short-term selling pressure is easing, though price would still be below the 50 SMA and 200 SMA cluster near $70.
If you’re already long, Wednesday’s close at $58.27 is your line in the sand. A daily close below it puts the $55.60 level in play and would say the death cross is starting to play out.
If you’re looking to go short, the ~$70 cluster where the 50 SMA and 200 SMA now sit is the setup. A failed rally into that zone, followed by a reversal, would confirm sellers are still in charge.
If you’re already short, a close back above the 200 SMA (~$70.19) is your risk level. That would mean the death cross gave a false signal, putting the downtrend in serious question.



