


If you trade XAG/USD, silver CFDs, silver futures, or silver ETFs, here’s a deeper dive into what moved silver this week and what to watch going into next week.
Silver started the week with a boost from the Iran deal, climbed above $71, and then fell back. Weekly close: $64.85. Weekly change: –4.66%.
The Week in Review
The week played out in two parts: silver gained early on, but the backdrop turned less supportive later in the week.
Monday: The Iran Bounce
The weekend deal between the US and Iran sent one signal to the market: the Strait of Hormuz would reopen. Oil fell. Rate-hike expectations compressed from roughly 90% to roughly 60% in a single session.
Iran deal → Strait reopens → oil falls → inflation expectations ease → rate hike odds fall → silver shines.
Tuesday–Wednesday: The Fed Shifts Hawkish
The Fed held rates at 3.50–3.75%. Unanimous 12-0. That part was priced at 97%.
The dot plot was the surprise. The dot plot shows each Fed member’s projection for where rates should be at year-end, and most were now pointing toward at least one 2026 hike. Chair Warsh withheld his own dot.
Warsh also overhauled the post-meeting policy statement, cutting it from 341 words to 130 and removing every phrase that signaled future rate cuts.
Silver reversed. Rate-hike odds reversed with it, climbing back toward 90%.
Thursday: The Low
Silver fell a bit over 3% on the day, pressured by the stronger dollar and renewed expectations that rates could stay higher for longer.
Friday: Continued Weakness
US markets were closed for Juneteenth, but spot silver continued trading globally. Silver drifted lower into Friday’s close.
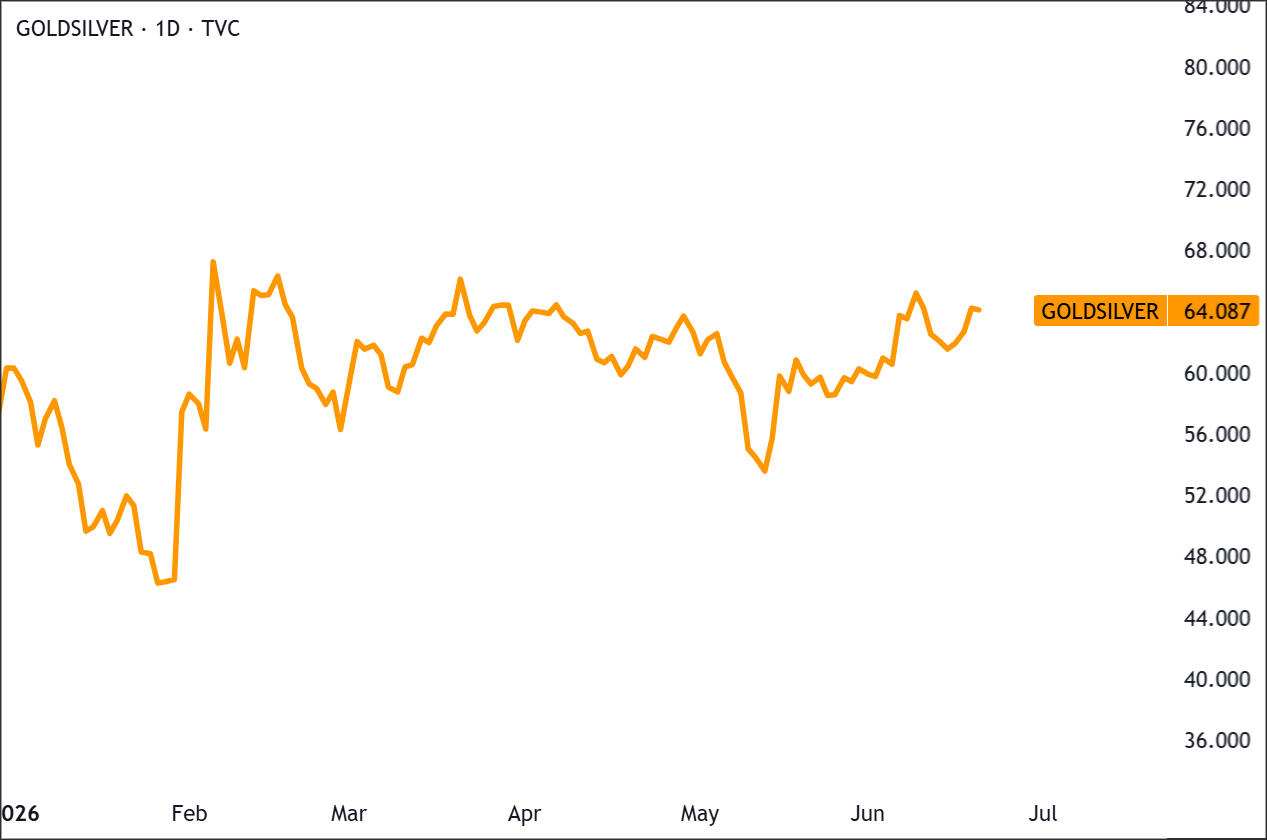
The Gold/Silver Ratio
The gold/silver ratio, which measures how many ounces of silver it takes to buy one ounce of gold, widened from 62.0 last week to 64.08.
A widening ratio means silver underperformed gold.
Gold fell 1.51%. Silver fell 4.66%.
Both metals respond to the same monetary forces: real rates, the dollar, and rate expectations.
Silver moves more in both directions because it trades in a thinner, more speculative market than gold and carries real industrial demand from solar, EVs, and electronics that ties it to economic cycles in a way gold doesn’t.
When rate expectations shift hawkishly, silver falls harder. This week confirmed that.
Managed Money Positioning
Managed money refers to large hedge funds and institutional traders who bet on silver futures.
No Commitment of Traders (COT) report this week. The CFTC was closed for Juneteenth on Friday.
The most recent available data is from the June 9 report, which showed net long positioning at 10,403 contracts, light, with no significant crowd leaning either way. That data predates this week’s FOMC-driven selloff.
Technical Backdrop
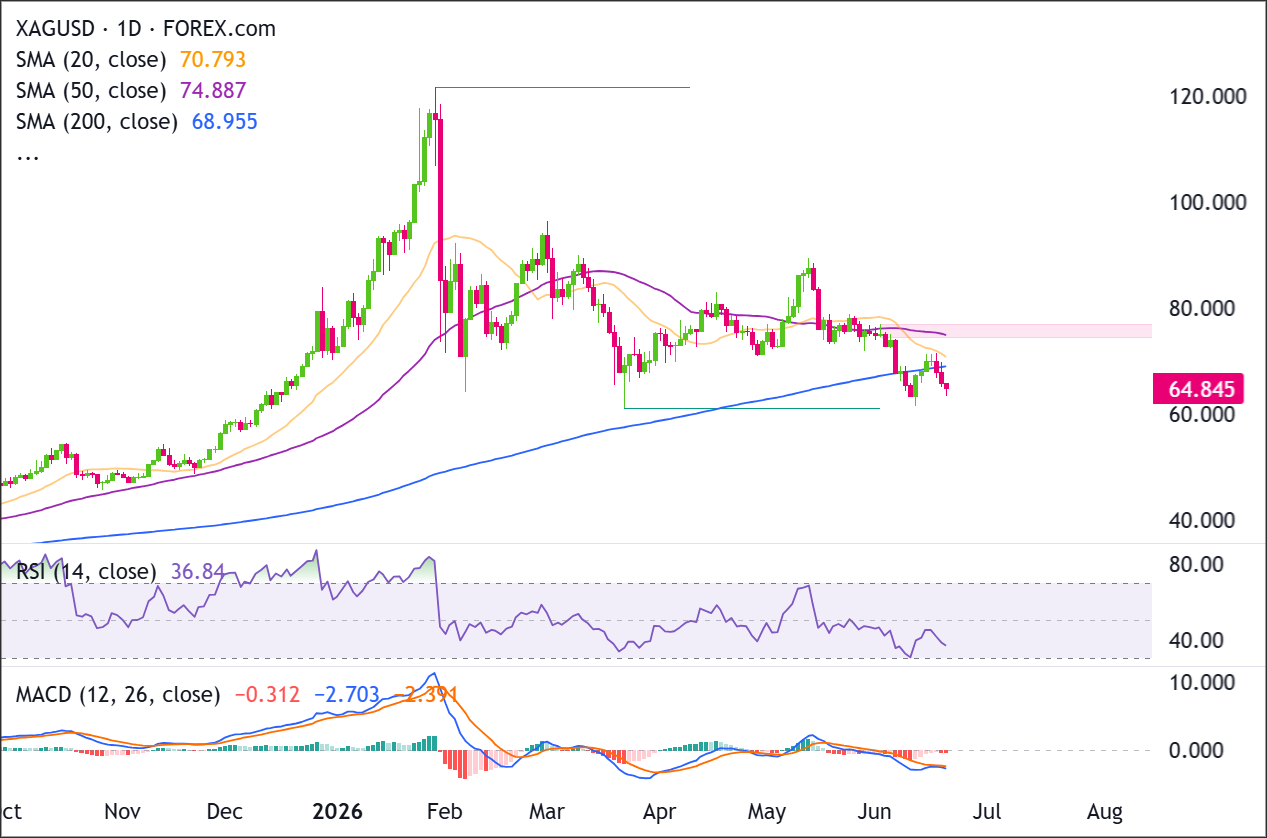
Price closed at $64.85, with every moving average above it and declining. That’s not a bullish structure.
Recent Price Action
Recent price action shows sellers still controlling the short-term structure after price rejected the $68.955–$70.793 area and rolled back toward $64.845.
Buyers need to defend $62.00–$64.00 and reclaim $68.955–$70.793 to stabilize the chart, while sellers need a clean break below $62.00 to confirm continuation lower.
Moving Averages
The 20 SMA sits at $70.793, and the 50 SMA sits at $74.887. Both are declining and are stacked $6 to $10 above the current price. They’re potential ceilings on any recovery.
The 200 SMA sits at $68.955. Price closed at $64.85, more than $4 below it.
Last week, silver closed just below the 200 SMA and looked like it might reclaim it. This week’s dot plot drove the price down through it. That level is overhead resistance now.
Momentum
RSI is at 36. Below neutral, but not oversold.
A reading below 30 signals selling exhaustion. At 36, there’s room to fall further before that signal appears.
The MACD remains in a bearish configuration, with momentum still favoring sellers. However, downside momentum is beginning to slow, which can sometimes precede a period of consolidation or a relief bounce.
Key Support & Resistance Levels
The technical picture remains challenging, with key resistance levels sitting above the current price.
| Level Type | Price Zone | Technical Significance |
|---|---|---|
| Major Resistance | $74 to $75 | 50 SMA at $74.887, declining; a significant ceiling on any meaningful rally |
| Secondary Resistance | $70 to $72 | 20 SMA at $70.793 and this week’s high at $71.56 |
| Immediate Resistance | $68.955 | 200 SMA; price closed well below it this week and must reclaim this level for the technical picture to improve |
| Immediate Support | $63.28 | This week’s low, where buyers stepped back in |
| Psychological Support | $60.00 | Round number below this week’s low |
| Psychological Support | $50.00 | Significant round number below $60; next key level if $60 fails to hold |
Current Market Conditions at a Glance
Everything we just covered, in one place.
| Indicator | Reading | What It’s Telling You |
|---|---|---|
| XAG/USD Close | ~$64.85 | Down 4.66% on the week. Silver ran to $71.56 Monday on the Iran deal, then reversed after the Wednesday dot plot. |
| Distance from ATH ($121.67) | ~46% below | Deep in correction territory. The January blow-off and the Fed’s hawkish shift are both still doing damage. |
| 200 SMA | $68.955 | Price closed more than $4 below it. Overhead resistance now. Reclaiming it is the first technical requirement. |
| 50 SMA | $74.887 | Declining and well above price. A significant ceiling on any rally, not an immediate concern. |
| RSI (14-day) | 36 | Below neutral. Not oversold. Room for further selling before the indicator signals exhaustion. |
| MACD | Bearish, histogram narrowing | Line (–2.703) below signal (–2.391). Histogram –0.312, negative and narrowing. Selling momentum is slowing. |
| Gold/Silver Ratio | 64.08 | Widened from 62.0 last week. Silver underperformed gold. The hawkish dot plot hit silver harder than gold. |
| Managed Money Positioning | No COT report (Juneteenth) | Last known data from June 9: net long 10,403 contracts, light positioning. This week’s selloff appears macro-driven. |
| Brent Crude | ~$80/bbl | Down ~8.5% on the week on the Iran deal. Iran has since closed the Strait of Hormuz. Oil could gap higher on Monday depending on Sunday’s talks in Switzerland. |
| Fed Rate Expectations | ~90% hike odds by year-end | Back near pre-Iran-deal levels after the dot plot. Hawkish rate expectations are weighing on silver. |
| Next Key Events | Iran talks Sunday; PCE Thursday, June 25 | Sunday’s Switzerland talks determine whether oil stays under pressure or reverses. PCE Thursday tests the FOMC’s inflation assumptions. |
The Big Things to Watch
Two events compete for silver’s direction next week. The Strait closure is the more immediate risk.
The Strait of Hormuz
Iran closed the Strait of Hormuz after what it called a ceasefire violation by Israel. US-Iran talks are set to open in Switzerland on Sunday.
The same logic that lifted silver on Monday now runs in reverse. If Sunday’s talks stall:
Strait closes → oil rises → inflation expectations climb → rate hike pressure intensifies → silver under pressure.
If the talks hold and the Strait reopens, oil could fall, and silver gets its macro tailwind back.
Watch Sunday before sizing into any position for next week.
May PCE: Thursday, June 25
PCE arrives Thursday, one week after a dot plot that raised the median 2026 rate projection from 3.4% to 3.8%, with nine of eighteen members projecting at least one hike.
A hot print, with core PCE near or above the FOMC’s own 3.6% year-end PCE forecast, could reinforce the rate-hike path and keep pressure on silver.
A soft print creates doubt about the FOMC’s inflation assumptions, and that could give silver its first real opening to challenge the 200 SMA at $68.955.
This article references the PCE report and its role in shaping Fed rate expectations, which can be easy to misread without context on how inflation gauges work. Premium members can read our lesson:
📖 Inflation: The Force That Moves Central Banks
Reading this helps you understand what PCE actually measures and why the Fed prefers it over CPI, how inflation readings relative to forecasts shift rate expectations, and why the gap between a hot or soft print and the FOMC’s own projections is what actually moves markets.
And if you’re not a Premium subscriber yet, now’s a good time to sign up.
With Babypips Premium, you get full access to School of Pipsology lessons that help you understand not just what the data shows, but how inflation gauges like PCE feed directly into central bank decisions and the market moves that follow.
Key Levels to Watch
If you’re looking to go long, wait for a confirmed close above the 200 SMA at $68.955, with follow-through on the next session.
Price is more than $4 below it right now. Buying into that gap without confirmation means fighting both the technical structure and a macro backdrop with 90% rate-hike odds. A soft PCE print on Thursday is the most likely catalyst to create that opportunity.
If you’re already long, the 200 SMA at $68.955 is your line. A close above it improves the picture. A failure to reach it, or a test that reverses back below, confirms it as overhead resistance and puts $63.28 back in play as the next level down.
If you’re looking to go short, a break below $63.28 that holds for a full session is the setup. That was this week’s low and where buyers returned. A hot PCE print on Thursday is the most likely catalyst to push through it. If price holds below $63.28, $60 is the next area of reference.
If you’re already short, the 200 SMA at $68.955 is your invalidation level. A close above it means the picture has shifted.


