


If you trade XAG/USD, silver CFDs, silver futures, or silver ETFs, here’s a deeper dive into what moved silver this week and what to watch going into next week.
Monday looked ugly.
XAG/USD sat near $74, down roughly 15% since the Iran war began in late February.
The chain crushing silver was simple: Hormuz closure → energy shock → persistent inflation → frozen Fed → elevated real yields → non-yielding assets punished.
Then Wednesday.
Reports confirmed the Trump administration passed a one-page peace proposal through Pakistani mediators to Tehran. Formal end to hostilities. Gradual reopening of the Strait of Hormuz.
Brent crude dropped sharply on the news. Silver vaulted from $75 to above $82 in two sessions.
Friday complicated things.
US-Iranian exchanges of fire resumed near the Strait. Guided missile destroyers transited. US Central Command, the US military’s regional authority for the Middle East, stressed “no escalation.”
Silver pulled back. It closed near $80.30.
The Jobs Number Piled On
April nonfarm payrolls came in at 115,000. Against a consensus of 62,000. A big beat.
Usually, that is dollar-bullish and silver-bearish. But average hourly earnings grew just 0.2% month-on-month and 3.6% year-on-year. Both below estimates.
Soft wages → less inflation pressure → less hawkish Fed → weaker dollar → silver holds.
Silver Lapped Gold This Week
Gold gained roughly 2% on the week to close near $4,720. Silver’s 7% weekly gain left gold in the dust.
The gold/silver ratio, which measures how many ounces of silver it takes to buy one ounce of gold, compressed to 58 this week.
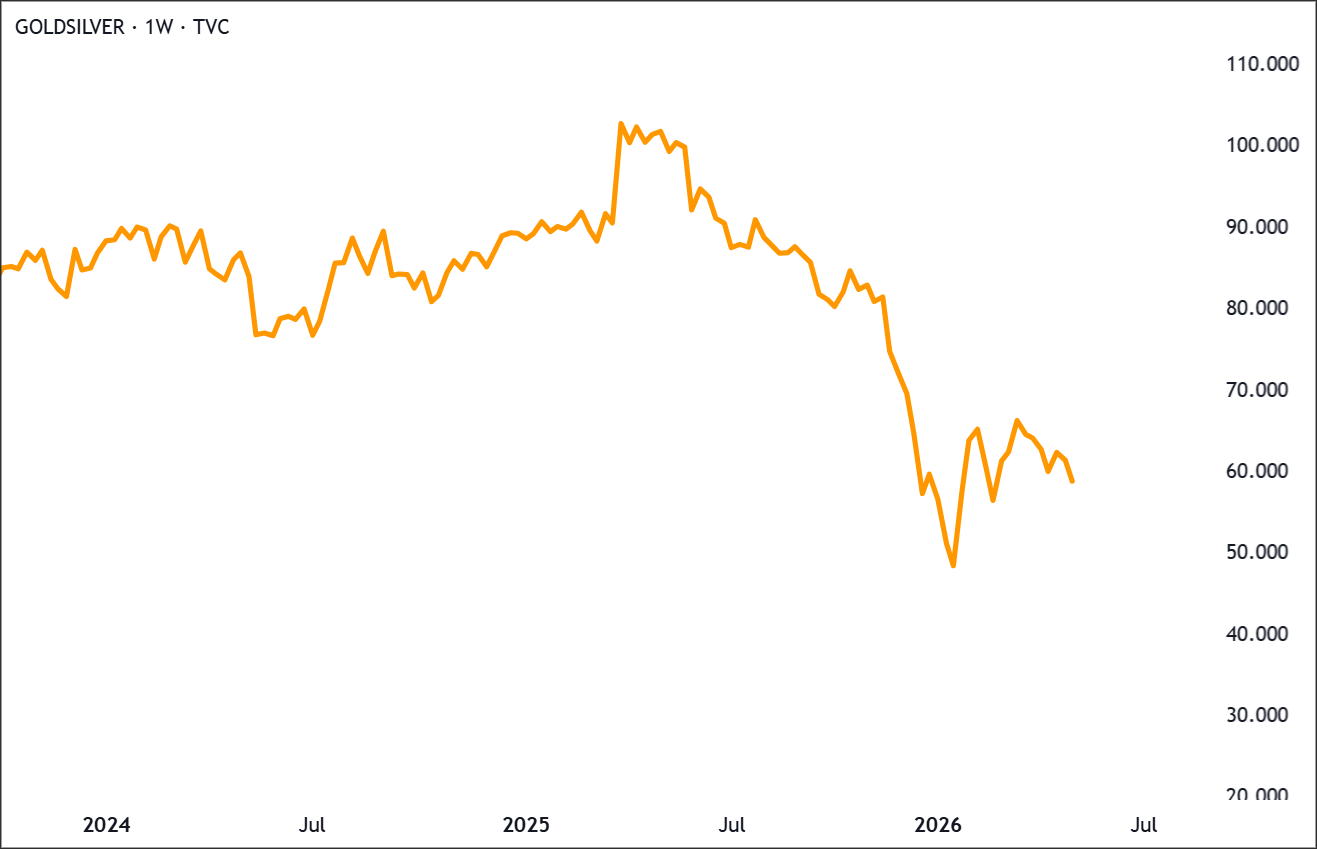
A falling ratio means silver is outrunning gold.
That rotation signals investors moving toward the higher-beta industrial-monetary metal, not just the safe haven.
The Big Funds Already Sold
COMEX managed money positioning remains well below January extremes when specs piled in above $100.
Managed money refers to large hedge funds and institutional traders who bet on silver futures.When they are all piled in on the same side, the market is crowded and vulnerable to a violent reversal when they exit.
Right now, they are not crowded. That is actually good news. A less crowded setup is how durable recoveries start.
Technical Backdrop
Price reclaimed a key level this week. Here’s what the chart actually shows.
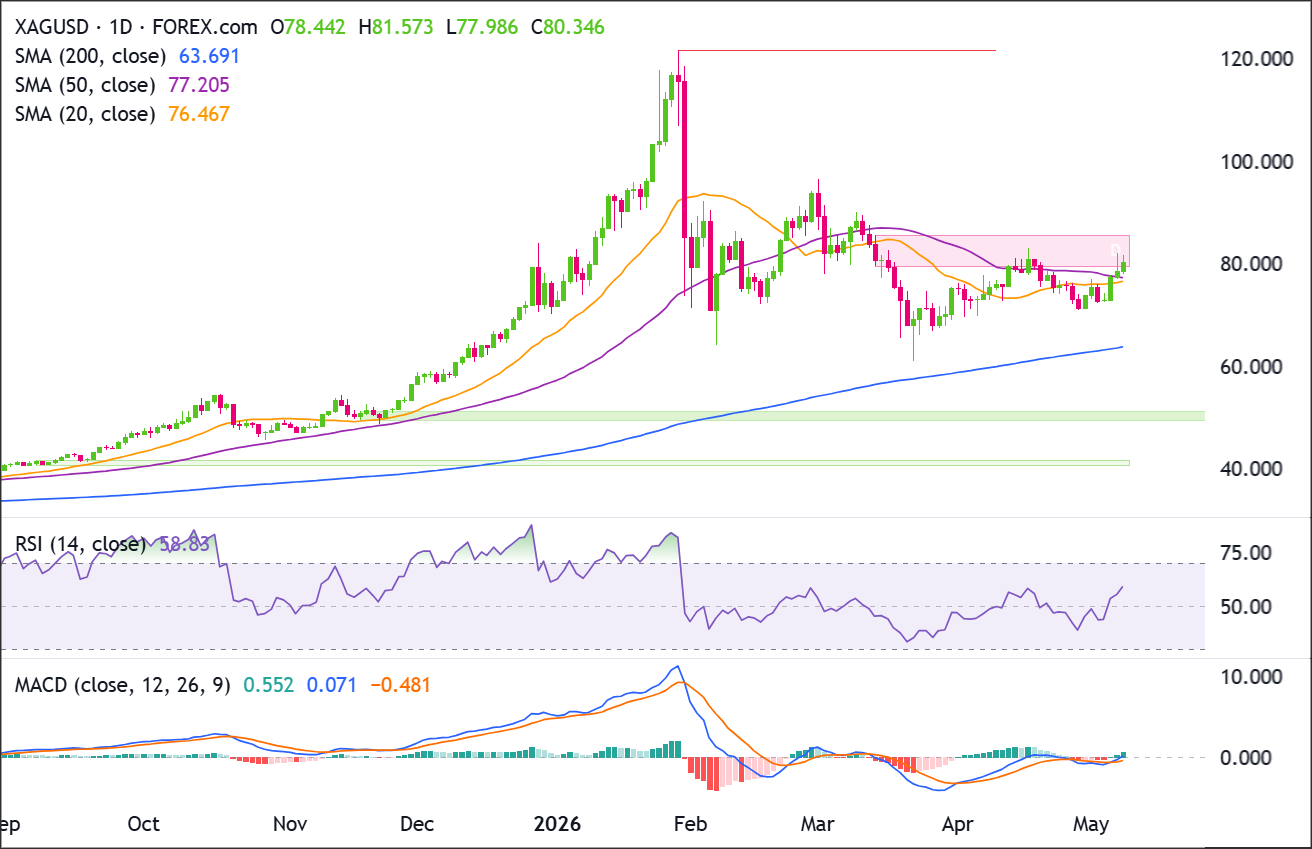
Silver remains in a strong long-term uptrend, but after the explosive rally toward 120 earlier this year, price has spent the last several months consolidating in a broad (and ugly) range.
Moving Averages
The 200 SMA sits near $63.70. Price has stayed well above it throughout the entire war selloff, even when silver hit near $70 at the worst of it.
That is the structural bull market floor, and it was never seriously threatened.
Rather than fully collapsing after the spike top, silver has been building a sideways base above the rising 200 SMA.
That is constructive because it suggests the market is digesting gains rather than completely reversing the uptrend.
Good to know, but not the story this week.
The story this week is the 50 SMA at ~$77. Silver spent weeks below it after the war drove prices down.
This week’s rally pushed price back above it for the first time since the conflict escalated. That is the level to watch.
Momentum
RSI sits in the mid-50s. Neutral, with room to run.
MACD crossed made a bullish crossover, but the histogram is narrow. This move needs follow-through next week before you trust it.
Key Support & Resistance Levels
Here are the levels worth having on your screen heading into next week.
| Level Type | Price Zone | Technical Significance |
|---|---|---|
| Major Resistance | $88–$90 | Pre-ATH consolidation; sellers’ memory from the January approach to $100 |
| Secondary Resistance | $83–$85 | Previous weekly high |
| Immediate Resistance | $80–$82 | Friday close; must hold as new support to confirm trend change |
| Immediate Support | ~$77.20 | 50 SMA; first test on any pullback |
| Major Support | $72–$74 | Prior swing lows from the war selloff |
| Structural Floor | ~$63.70 | 200 SMA; the long-term bull market floor |
Current Market Conditions at a Glance
Everything we just covered, in one place.
| Indicator | Reading | What It’s Telling You |
|---|---|---|
| XAG/USD Close | ~$80.30 | Up 7% on the week. Ceasefire hopes and soft US wages drove the move. |
| Distance from ATH ($121) | ~34% below | Still deep in correction territory. The January blow-off did real damage. |
| 200 SMA | ~$63.70 | Price is well above it. The structural trend was never threatened, even at the war selloff lows. |
| 50 SMA | ~$77.20 | Price reclaimed it this week after spending weeks below it. Key support on any pullback. |
| RSI (14-day) | Mid-50s | Neutral. Not overbought, plenty of room to run if the rally has legs. |
| MACD | Bullish crossover | Positive signal, but the histogram is narrow. One good week doesn’t make a trend. |
| Gold/Silver Ratio | 58 | Compressing. Silver is outrunning gold, a sign investors want the higher-beta trade. |
| Managed Money Positioning | Well below Jan highs | Specs are not crowded. Less risk of a sudden flush if the mood turns. |
| Brent Crude | ~$101/bbl | Down ~13% on the week. Ceasefire optimism is the main driver of silver’s rally. |
| Fed Rate Expectations | No cuts priced through 2026 | The Fed is frozen. A persistent headwind until inflation cools. |
| Next Key Event | April CPI (May 12) | Hot print kills the rally. Cool print gives it legs. This is the number to watch. |
Bottom Line
Silver rallied this week. The question is whether it can hold.
Real Rally. Fragile Foundation.
Silver reclaimed $80 on real catalysts.
Ceasefire optimism drove oil down, soft wages kept the dollar from rallying on a strong jobs beat, and silver absorbed both as a net positive.
Price pushed back above the 50 SMA. That’s important.
The selling pressure eased this week. Don’t extrapolate more than that.
The ceasefire is fragile. US Central Command conducted defensive strikes the same week diplomacy was supposedly progressing.
Roughly 230 loaded tankers remain stranded or waiting inside the Persian Gulf due to the ongoing crisis and effective closure of the Strait of Hormuz.
The Big Thing to Watch
The April US CPI print lands on May 12.
A hot number reactivates the Hormuz-inflation-hawkish Fed chain. This week’s gains could unwind in one session.
A cool number validates the soft wages signal from Friday and gives this rally genuine legs.
Treat rallies to $85 as trim zones unless Hormuz resolution is confirmed. Consider pullbacks toward the 50 SMA at ~$78.55 as safer entry points if you remain a silver bull.


