


If you trade XAG/USD, silver CFDs, silver futures, or silver ETFs, here’s a deeper dive into what moved silver this week and what to watch going into next week.
Monday had no business being bullish.
Trump called Iran’s counter-proposal to end the war “totally unacceptable” and said the ceasefire was on “massive life support.”
Tehran was demanding sovereignty over the Strait of Hormuz and compensation for war damages.
Oil was rising.
And silver surged 6% anyway.
Markets were positioning ahead of Trump’s state visit to China.
Traders were betting on a more constructive US-China trade backdrop coming out of the summit.
That matters for silver. It has more industrial demand exposure than gold, so when markets start pricing stronger trade and growth expectations, silver tends to move harder.
Silver pushed above $87 by Monday’s close.
Then Tuesday happened.
April’s Consumer Price Index landed on Tuesday at 8:30 am ET. Headline inflation: 3.8% year-over-year. Against a consensus of 3.7%.
Not a disaster. Just a beat in the wrong direction.
Then came PPI on Wednesday. PPI, or the Producer Price Index, measures what businesses pay before prices reach consumers.
April’s reading: 6% year-over-year, the hottest in nearly four years.
Import and export prices also beat to the upside. Three inflation gauges. Three strikes against silver.
Hot CPI + scorching PPI + soaring import prices → higher-for-longer Fed → surging dollar → rising Treasury yields → silver weakens.
The Summit Came and Went. So Did Powell.
The Trump-Xi summit wrapped on Friday with no meaningful deal.
The outcome strengthened a fragile trade truce rather than resolving anything structural. The catalyst that drove Monday’s surge did not deliver.
Meanwhile, Powell’s term as Fed Chair expired Friday.
Kevin Warsh was confirmed by the Senate on Wednesday, 54-45, but his formal swearing-in is still pending.
Markets Are Now Pricing a Rate Hike by December.
CME FedWatch now prices zero probability of a rate cut anywhere in 2026.
Worse: markets now price roughly a 50% chance of a rate HIKE by December.
Higher rates are kryptonite for silver. Silver pays no yield.
When rates rise, the cost of holding silver over cash rises with them. Money flows out. Price drops.
Gold/Silver Ratio Widened.
Gold sold off too, closing near $4,540 and falling roughly 4% on the week.
Silver fell roughly 5.5%.
The gold/silver ratio, which measures how many ounces of silver it takes to buy one ounce of gold, widened to almost 60 this week.
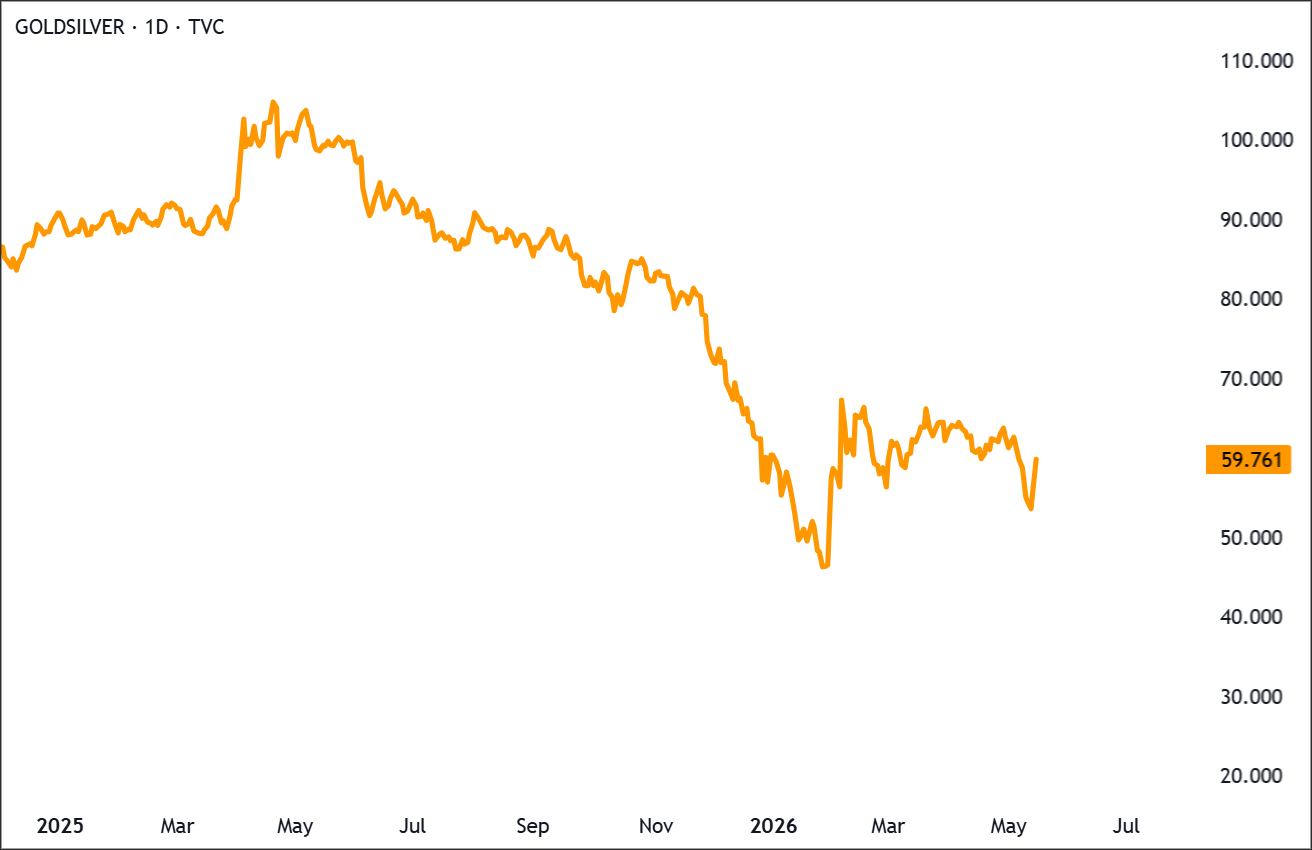
When conditions turned ugly, the market sold silver harder than it sold gold.
A rising ratio means silver is losing ground to gold.
Oil Surged.
Brent crude rose 8.1% this week, closing near $109 per barrel.
The Strait of Hormuz remains effectively closed.
The International Energy Agency warned this week that global oil markets could stay severely undersupplied through October, even if the conflict ends next month.
Expensive oil → persistent inflation → Fed stays frozen → silver stays pressured.
The Big Funds Are Not Crowded.
Managed money refers to large hedge funds and institutional traders who bet on silver futures. When they pile into the same side, the market gets crowded and vulnerable to a violent flush when they exit.
Right now, they are not crowded. The most recent CFTC data shows managed money net long positioning well below the extremes seen when silver was trading above $100 in January.
That is actually constructive. Less crowding means specs have room to add. That is dry powder.
If the macro picture improves, there is latent buying power sitting on the sidelines that has not been deployed yet.
Durable recoveries tend to start from exactly this kind of setup.
Technical Backdrop
Here is what the chart shows now.
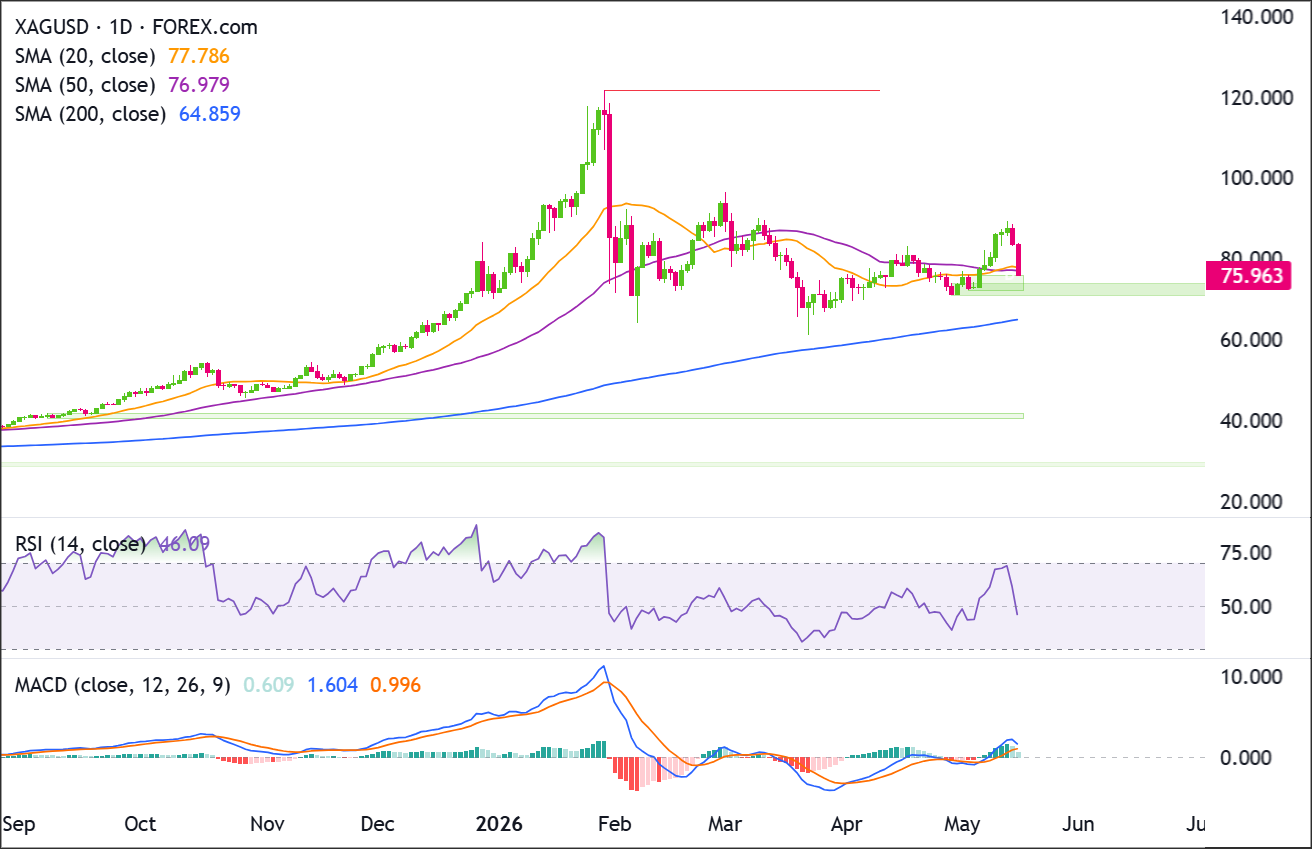
Moving Averages
The 200 SMA sits at $64.86. Price is well above it. The structural bull market floor was never threatened this week, even at the Friday lows.
The story is the 50 SMA at $76.98. Friday’s close at $75.96 puts price just below it. Not a clean breakdown. More like price is clinging to the underside.
The 20 SMA at $77.79 now sits above both price and the 50 SMA. Two short-term averages are stacked overhead. That is not a bullish picture.
Momentum
RSI sits at 46.09. Just below neutral. Not oversold, but drifting lower with room to fall before it signals a flush.
MACD shows the MACD line at 1.604 still above the signal at 0.996. No bearish crossover. But the histogram at 0.609 is positive and narrowing, which means bullish momentum is fading. Worth watching, not acting on yet.
Key Support & Resistance Levels
Here are the levels worth having on your screen heading into next week.
| Level Type | Price Zone | Technical Significance |
|---|---|---|
| Major Resistance | $87–$90 | This week’s spike high zone; pre-ATH consolidation area from January approach |
| Secondary Resistance | $83–$85 | Tuesday’s hold zone before the inflation rout began |
| Immediate Resistance | $76.98–$77.79 | 50 SMA and 20 SMA now stacked just above price |
| Immediate Support | $75–$76 | Visible consolidation support zone on the chart; price closed right on it |
| Major Support | $72–$74 | Prior war selloff lows; buyers defended here during the worst of the conflict |
| Structural Floor | $64.86 | 200 SMA; the long-term bull market floor |
Current Market Conditions at a Glance
Everything we just covered, in one place.
| Indicator | Reading | What It’s Telling You |
|---|---|---|
| XAG/USD Close | ~$75.96 | Down ~5.5% on the week. Silver pushed above $87 Monday and closed near the lows Friday. |
| Distance from ATH ($121.67) | ~37.6% below | Still deep in correction territory. This week’s spike barely dented the gap. |
| 200 SMA | $64.86 | Price is well above it. The structural bull trend was never threatened. |
| 50 SMA | $76.98 | Price closed just below it at $75.96. Clinging to the underside, not a clean breakdown. |
| RSI (14-day) | 46.09 | Just below neutral. Not oversold. Drifting lower with room to fall. |
| MACD | Bearish crossover | MACD line (1.604) is still above signal (0.996). Bullish momentum fading but not reversed. Watch for a crossover next week. |
| Gold/Silver Ratio | ~60 | Silver underperformed gold this week. |
| Managed Money Positioning | Below January extremes | Specs are not crowded long. Limits flush risk, but there is no fuel for a sustained push higher. |
| Brent Crude | ~$109/bbl | Up 8.1% on the week. Hormuz stays closed. The inflation driver is still running hot. |
| Fed Rate Expectations | 0% cut probability; ~51% hike by December | The most aggressive hawkish pricing since 2022. Three hot inflation prints in one week did this. |
| Next Key Event | FOMC Minutes (May 20) | Hawkish tone confirms the bear case. Any dovish signal sparks a short squeeze. |
Bottom Line: Trade Optimism Met an Inflation Problem
Silver opened the week on trade optimism. It ended the week repricing higher rates.
Silver’s push above $87 was not noise. Markets were pricing in the potential for US-China trade stabilization.
A productive summit would have been genuinely bullish for silver demand.
But it wasn’t.
Three hot data prints in three days compounded it. CPI at 3.8%. PPI at 6% YoY. Import and export prices both above estimates.
Markets immediately priced in no cuts, possible hike.
Here is where things stand:
- Silver closed at $75.96, just below the 50 SMA at $76.98 and right on the visible support zone.
- RSI at 46 is neutral and drifting. MACD is rolling over.
- The 200 SMA structural floor at $64.86 is nowhere near being tested. But if this support zone fails, the next floor is $72–$74.
The Big Thing to Watch
The FOMC meeting minutes drop on Wednesday, May 20.
The minutes cover the May 7 meeting, when the Fed held rates steady.
With CPI, PPI, and import prices all printing hot since then, traders will parse every sentence for signs of how seriously the Fed is weighing an actual hike.
A hawkish release adds conviction to the bear case. This $75–$76 support zone fails and silver tests $72–$74.
A dovish surprise, any language suggesting the Fed wants more data before committing to a hike, could trigger a squeeze back through the 50 SMA at $76.98 toward $80.
If you are a silver bull, watch how price behaves on this $75–$76 support zone Monday and Tuesday.
If it holds into Wednesday, consider buying carefully. If it breaks before then, the $72–$74 zone is the next level to work with.
If you are already long, the 50 SMA is the level to watch.
A clean reclaim and hold above it improves the setup. A rejection there is a reason to reduce exposure, because it would confirm the rally is still being sold.


