





Gold slid to a three-week low of $4,300 early this month, then pared most of these losses by September 7, landing back near $4,400.
The reversal makes more sense when you look at the 10-year TIPS yield.
Gold usually moves in the opposite direction when that yield changes, and this week offered a textbook example.
What Are Real Yields, Exactly?
A real yield is a bond’s return after inflation eats its share. Take the nominal yield on a 10-year Treasury, currently around 4.78%, and subtract expected inflation. What’s left is the real yield, which is basically the return an investor pockets in purchasing power terms.
The clean version of this number lives in the TIPS market (Treasury Inflation-Protected Securities). These bonds build in an inflation adjustment, so their yield shows the real rate already.
 As of September 4, the 10-year TIPS yield sat at 2.42%. Subtract that from the nominal 10-year, and you get the breakeven inflation rate, roughly 2.30% to 2.34%. That’s the market’s inflation forecast, baked into bond prices.
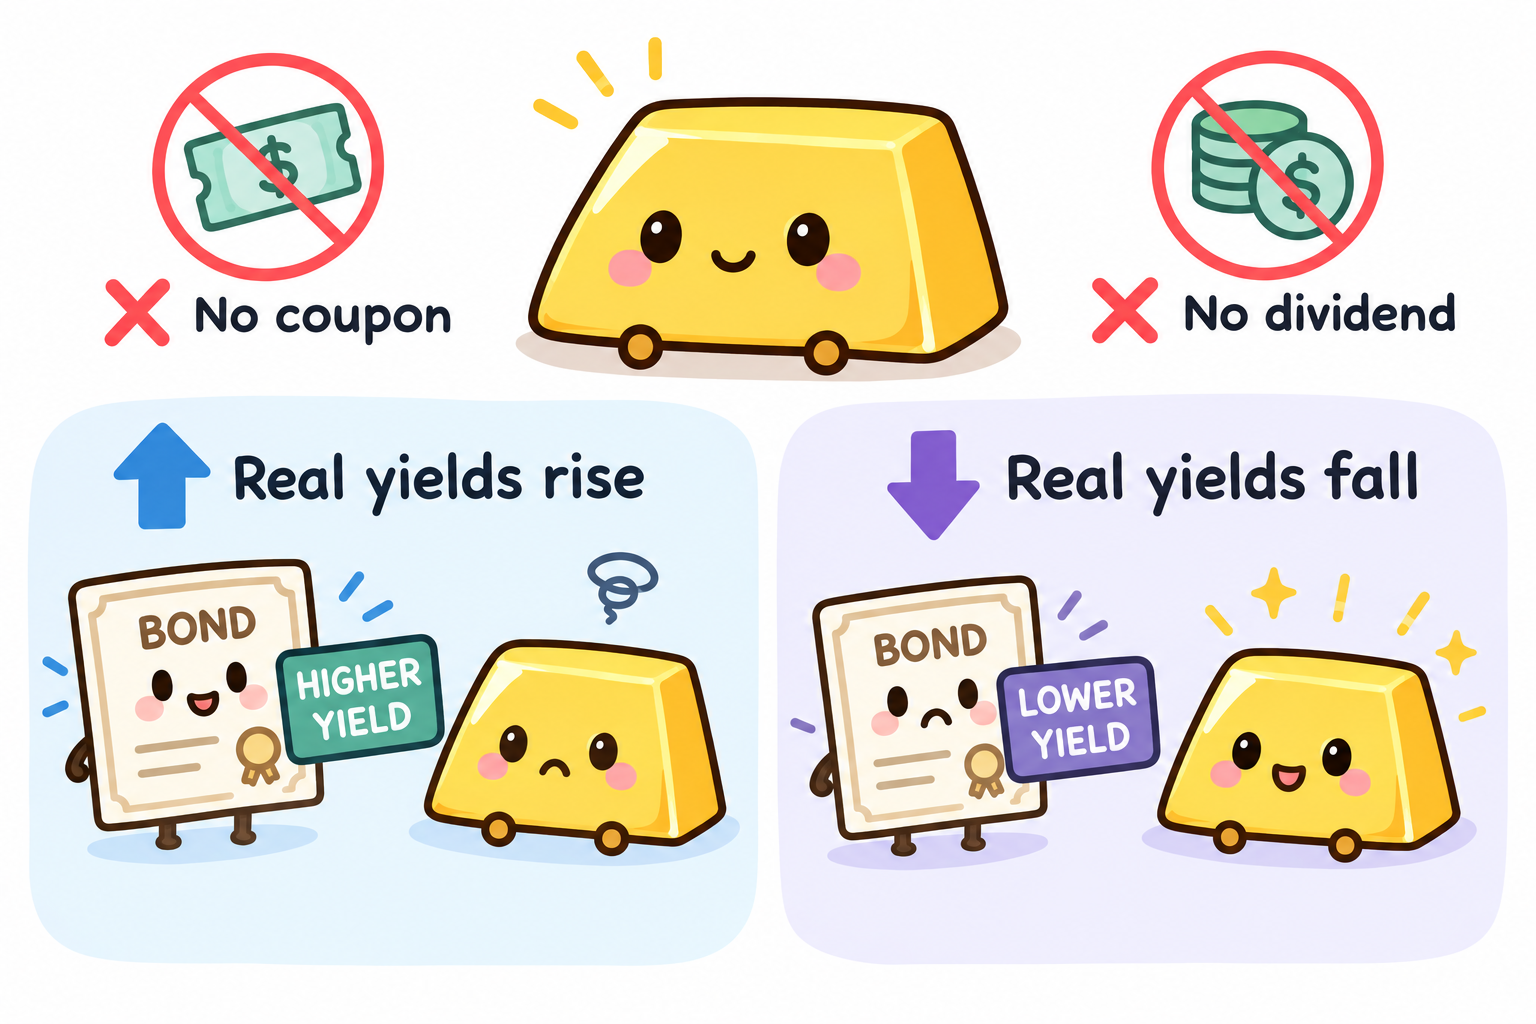
Gold pays no coupon and no dividend. So, when real yields climb, a bond starts paying you more for doing nothing risky, and gold’s appeal as a zero-yield asset shrinks.
On the flip side, when real yields fall, that opportunity cost drops too, and gold tends to catch a bid.
Traders have watched this relationship hold for decades, and it’s a core reason gold reacts hard to Fed-related headlines.
Why Real Yields Are Moving Right Now
Three forces have pushed real yields around this week, and each one traces back to the same question:
How hawkish will the Fed be at its September meeting?
Friday’s labor data set the scene. August nonfarm payrolls came in at 162,000, nearly triple the 56,000 economists expected, while unemployment held at 4.1%. Stronger jobs data tends to support a more hawkish Fed, since a tight labor market gives policymakers less reason to ease. This helped push rate hike odds for the September meeting up to roughly 59-60%, according to CME FedWatch pricing.
The Fed also enters its blackout period ahead of the meeting, so no official can clarify anything or walk back a market assumption. That leaves Thursday’s producer price data and Friday’s Consumer Price Index (CPI) to do the talking alone.
Then there’s geopolitical risk, which has kept oil elevated. Pricier energy feeds into headline inflation expectations. In theory, rising inflation expectations could pull real yields down and support gold, if nominal yields don’t rise just as fast. But that’s not what happened this week. Nominal yields moved right alongside the inflation fear, which kept real yields firm and capped gold’s upside.
Promoted: Gold Seems to be Extra Vulnerable Lately. Your Account Security Shouldn’t.
Gold price volatility from inflation reports and Fed commentary can have you jumping between brokerage, charting, and news accounts. LastPass helps generate and store strong, unique passwords, giving you one less thing to worry about when markets get noisy.
Try LastPass for Free Today! Disclosure: We may earn a commission from our partners if you sign up through our links, at no extra cost to you.
What This Means for Traders
The practical takeaway: watch the real yield, not just the headline inflation print. A hot CPI reading doesn’t automatically hurt gold. It depends on how nominal yields and inflation expectations move together.
If Friday’s CPI runs hot and the market reads it as fresh hike ammunition, real yields likely climb, the dollar likely strengthens, and gold tends to lead the pullback alongside other rate-sensitive assets. This scenario tests gold’s reputation as a pure safe haven.When rising real yields drive the move, gold can fall in the same session as stocks, and that catches traders off guard if they assumed gold would hedge everything.
Meanwhile, if core CPI stays soft and the market leans on that instead, rate-hike odds likely fade, real yields likely ease, and gold has room to push back toward its recent highs near $4,700.
This tendency echoes into currency pairs like AUD/USD and USD/CHF, both of which carry gold sensitivity through central bank reserve dynamics and safe-haven flows.
The Bottom Line
- Real yields (nominal yield minus expected inflation) set the opportunity cost of holding gold. Rising real yields tend to pressure gold; falling real yields tend to support it.
- The 10-year TIPS yield sat at 2.42% as of September 4, with the nominal 10-year around 4.78%.
- Gold swung from a three-week low near $4,304 to roughly $4,400 within the same week, largely tracking shifts in rate-hike expectations.
- August payrolls beat forecasts by a wide margin (162,000 versus 56,000 expected), which appears to have lifted rate-hike odds and pressured gold in the short term.
- Friday’s CPI print, landing during the Fed’s pre-meeting blackout, may carry outsized weight since no official commentary can soften a surprise.
What to Watch Next
Thursday, September 10: US Producer Price Index (PPI), likely to provide some context ahead of the official CPI release and give traders a clue how markets can react to hits or misses
Friday, September 11: US CPI, both headline and core, the last major inflation read before the Fed decision
Wednesday, September 16: FOMC rate decision, with markets pricing close to a coin-flip outcome
This week’s gold swing between $4,304 and $4,400 traces back to real yields, a driver that goes deeper than the headline inflation numbers most readers focus on. Premium members can read our lesson:
📖 What Makes Gold’s Price Move?
Reading this helps you understand why gold carries no yield of its own, how interest rate expectations shape its opportunity cost, and why the same CPI print can push gold in opposite directions depending on how nominal yields react.
And if you’re not a Premium subscriber yet, now’s a good time to sign up.
With Babypips Premium, you get full access to School of Pipsology lessons that help you understand not just where gold’s price is trading, but the interest rate and central bank forces setting its direction underneath the chart.



