


What if there was a way to sell near the top or buy near the bottom of a trend?
What if you were already in a long position and you could know ahead of time the perfect place to exit instead of watching your unrealized gains (a.k.a. your potential Tesla Cybertruck down payment or future designer sneaker collection) vanish before your eyes because your trade reverses direction?
What if you believe a currency pair will continue to fall but would like to short at a better price or a less risky entry?
Well, guess what? There is a way!
It’s called divergence trading.
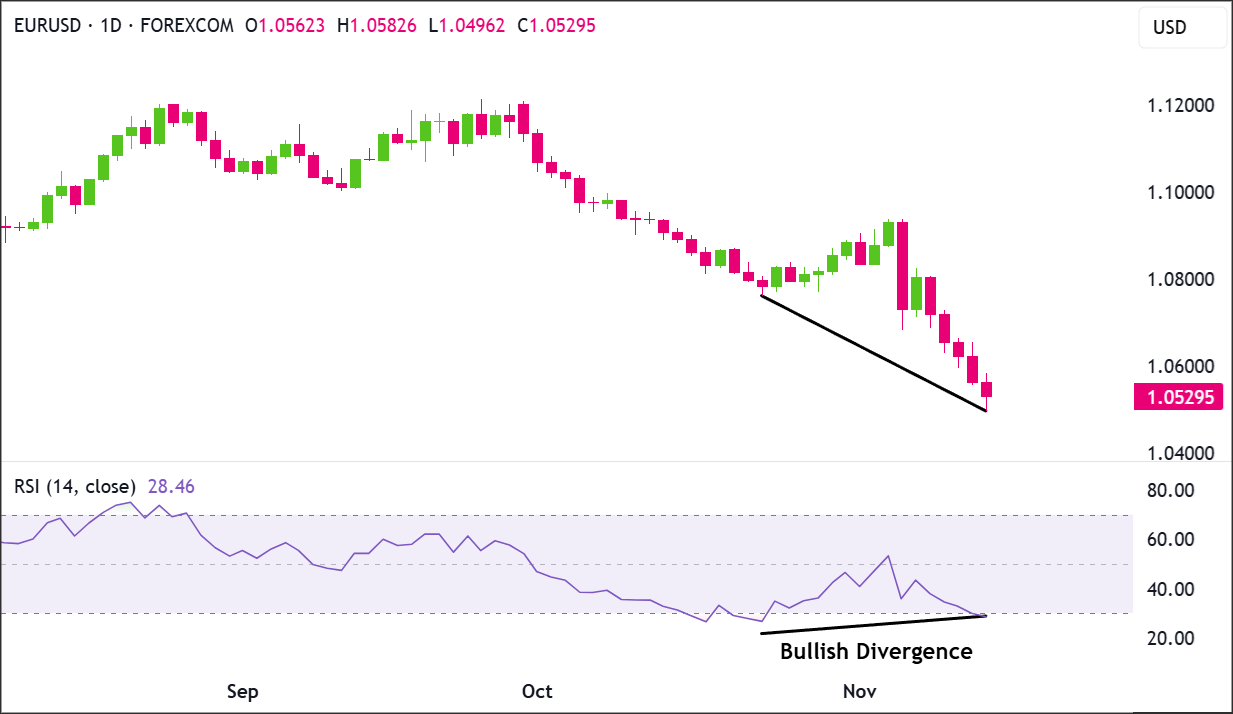
In a nutshell, divergence can be seen by comparing price action and the movement of an indicator.
It doesn’t really matter what indicator you use. You can use RSI, MACD, Stochastic, CCI, and others.
The great thing about divergences is that you can use them as a leading indicator, and after some practice, it’s not too difficult to spot.
When traded properly and combined with other confirmation tools, you can be consistently profitable with divergences.
The best thing about divergences is that you’re usually buying near the bottom or selling near the top. This makes the risk on your trades very small relative to your potential reward.
Cha-ching!

Now, before you start seeing dollar signs and mentally redecorating your future beach house, a word of caution: divergences are powerful, but they are not magic.
They can and do produce false signals!
Price can keep trending against a divergence longer than your account balance can survive. That’s why smart traders never rely on divergences alone.
They use them alongside other tools like support and resistance levels, trendlines, and candlestick patterns to confirm their entries.
Think of divergences as one very useful ingredient in your trading recipe, not the entire meal.
Trading Divergences
Just think “higher highs” and “lower lows”.
Here’s an example:
Price and momentum normally move hand in hand like peanut butter and jelly, Mario and Luigi, Batman and Robin, Beyoncé and Jay-Z, salt and pepper… You get the point.

If the price is making higher highs, the oscillator should also be making higher highs.
If the price is making lower lows, the oscillator should also be making lower lows.
If they are NOT, that means price and the oscillator are diverging from each other. And that’s why it’s called “divergence.”
Divergence trading is an awesome tool to have in your toolbox because divergences signal to you that something fishy is going on and that you should pay closer attention.
Using divergence trading can be useful in spotting a weakening trend or reversal in momentum. Sometimes you can even use it as a signal for a trend to continue!
One quick tip before we dive deeper: Divergences tend to be more reliable on higher timeframes like the 4-hour or daily chart.
You’ll still see them on lower timeframes, but they’re noisier and more prone to fakeouts. Keep that in the back of your mind as you learn to spot them.
There are TWO main types of divergence:
- Regular
- Hidden
(Some traders also recognize a third type called extended divergence, which is similar to hidden divergence but a bit less reliable. We won’t focus on it here, but it’s good to know it exists as you continue your trading education.)
What’s Coming Next
In this series, we’ll teach you how to spot regular and hidden divergences, walk you through real trade examples, show you how to avoid entering too early, and lay out the 9 rules every divergence trader should memorize.
We’ll even cover why divergences should never be your only reason for entering a trade.
By the end, you’ll have a complete divergence trading toolkit ready to go.
Let’s get started!