


USDCHF
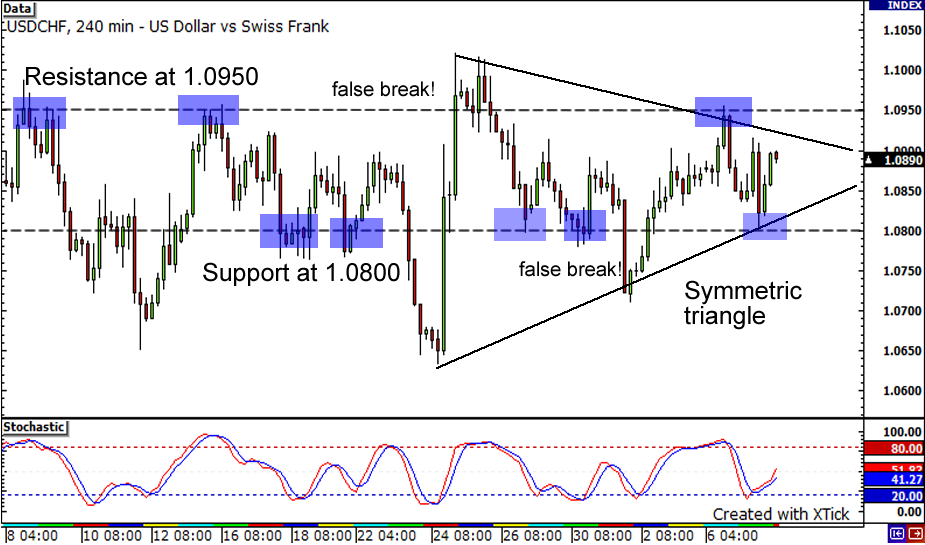
Look at that symmetric triangle formation on the USD/CHF 4-hour chart shown above! The pair has encountered strong resistance at the 1.0950 mark and support at the psychologically significant 1.0800 level, give or take a few false breaks in between. Right now, the price seems to be consolidating towards the middle of its range… Oh the tension between buyers and sellers! But which side would gain the upper hand? The stochastic is still rising, which means that the price could still move higher. In the blue corner… buyers could encounter resistance at the top of the symmetric triangle and the 1.0950 level before getting knocked down. And in the red corner… sellers could find it tough to break the bottom of the triangle or the support at 1.0800. Let’s get ready to rumble!
EURJPY

Shown is a daily chart of the EURJPY from the beginning of the year. As you can see, that pair has been on a strong rise as the uptrend line has served as good support. Oh wait, what’s that I see? Yesterday, we saw bearish red candle that took price action BELOW the trend line. Could this be a signal that the uptrend is now broken? Take not that it is currently hitting the previous low and prior support at around 131.50, which also coincides with the .618 Fibonacci level. Could we see price bounce back? Will the uptrend line and prior support at 133.00 now be resistance? Or will price continue to shoot down? We shall see!
GBPUSD
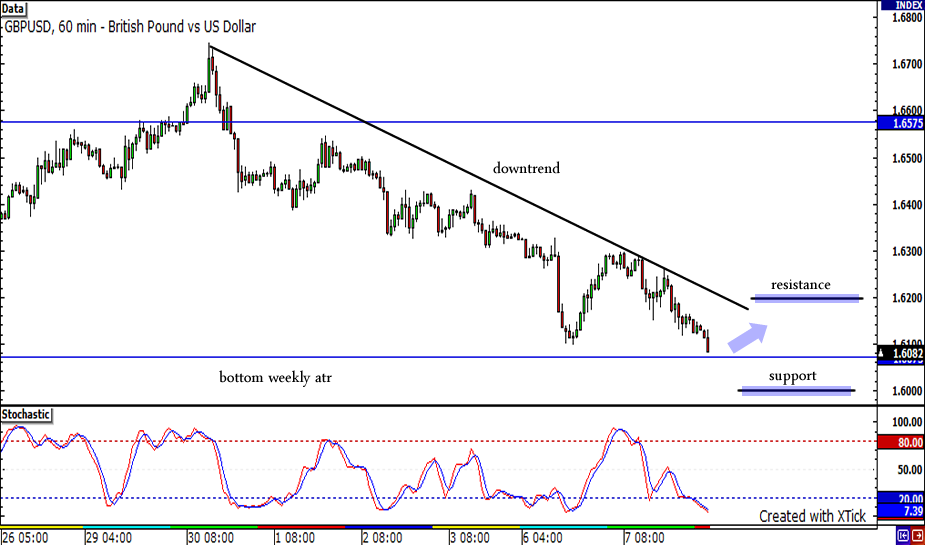
Sexy 60-minute chart of GBP/USD is shown above! The pair looks to be in a short term downtrend that peaked last June 30. Currently, the price is already approaching the bottom of its weekly trading range. The price might bounce upon hitting this support. If it does, it might go up until it sees an immediate resistance at the downtrend line or the 1.6200 psychological price. It might do just that since the stochastic is already indicating that conditions are oversold. On the other hand, if the price closes below the bottom weekly range, it might head down until it finds support at the 1.6000 psychological level.


