


Is that a trend forming on the hourly EURUSD chart or is it simply ranging? Yesterday, we saw the key technical and psychological support level at 1.3900 hold once again!
Price just bounced upwards and is now currently treading another pivotal resistance level. Notice how the 1.4000 price level has provided firm support for the pair previously. This price level will be tough to break as it also coincides nicely with the 38.2% Fibonacci level.
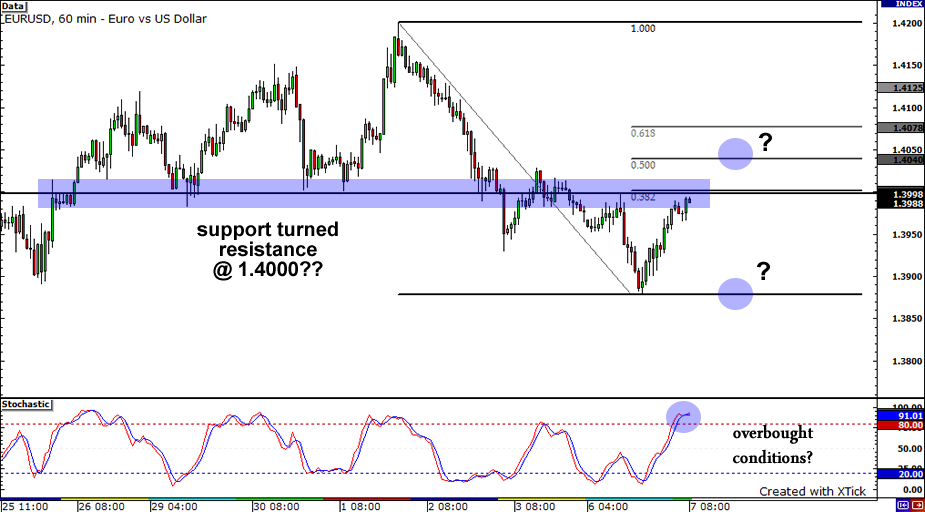
If 1.4000 holds, we may see the pair drop back again to retest 1.3900. On the flip side, if the resistance at 1.4000 breaks, the pair could target the 50% (1.4050) and the 61.8% (1.4078) Fibonacci levels correspondingly.
AUDUSD
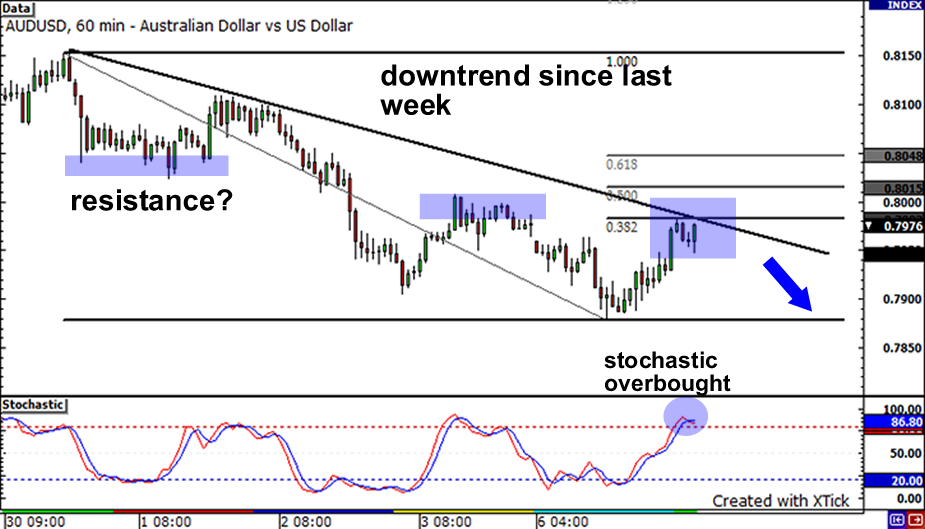
Although the AUD gained against the USD yesterday, we see here that the pair has been on a downtrend since last week. Price action has repeatedly been showing lower daily highs, displaying the subtle strength of the dollar the past week.
After hitting a new low at .7879 – a level it hasn’t hit in around 2 weeks – price retraced a bit but now could be encountering some resistance as it approaches the .382 Fibonacci level as well as the downtrend line. With stochastic showing that overbought conditions, we may see sellers in action as they help the pair continue its downward movement.USDJPY
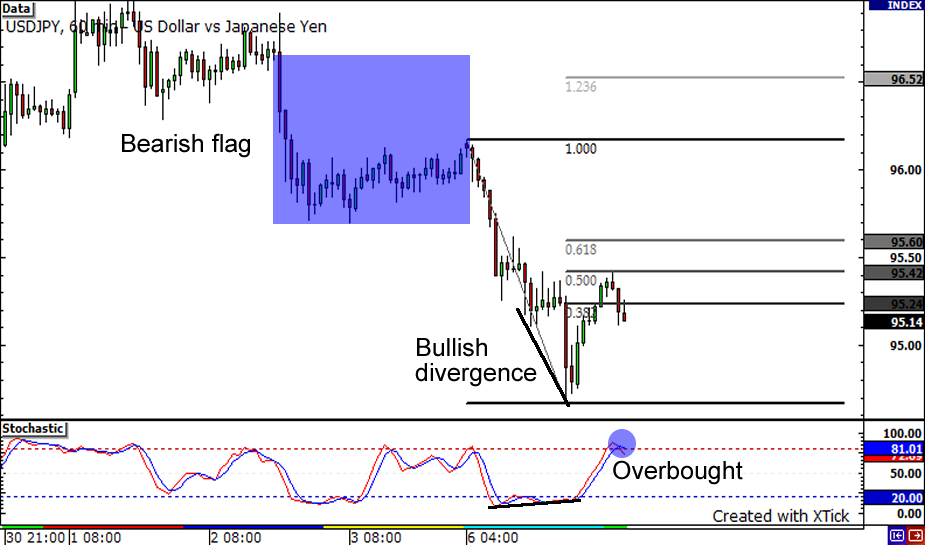
The Fourth of July festivities may be over but this pair is still waving a flag… a bearish flag, that is. The almost-vertical drop from last week was followed by a short period of consolidation.
This usually signals that another sharp drop is due. And look at that dive! Upon breaking below the psychologically significant 96.00 handle, the pair slid way down below the 95.00 mark and reached a low of 94.67. That’s close to a 140-pip high dive! Bullish divergence has formed, with the price drawing lower lows and the oscillator tracing higher lows.
The pair is now taking a breather and has retraced up to the 50% Fibonacci level. The stochastic is currently in overbought territory, which means that the pair could resume its downward movement afterward.


