


EURUSD: 4-hour Chart
Check out the four-hour on the EURUSD guys! Yesterday, the pair did a bearish dive after testing and failing to break through resistance at 1.4200. It fell as much as 200 pips, piercing through the significant psychological 1.4000 price region and rising trend line.
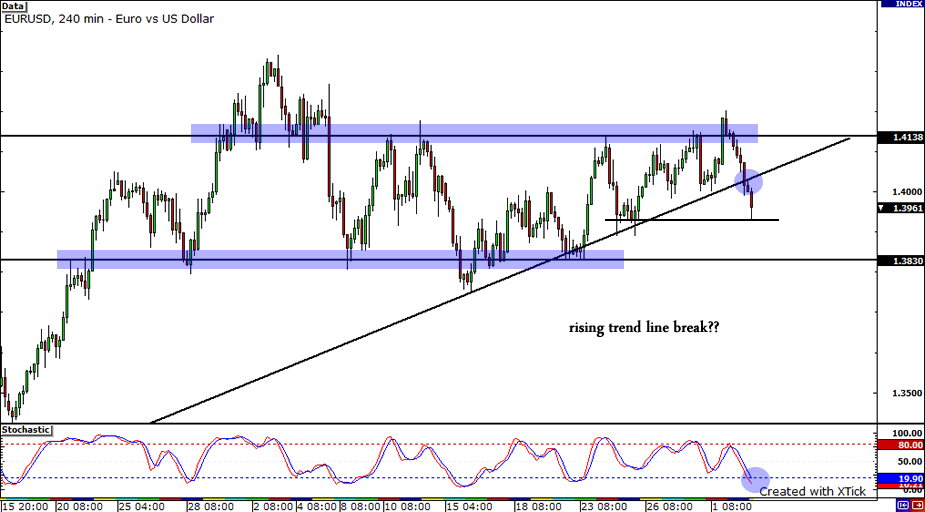
On a much larger time frame, we can see that the pair still respects a certain range, with 1.3800 acting as its lower bound support. Stochastics is now indicating oversold conditions and the price stands around the 1.3950 region. Possible scenarios?
Well, if the sellers continue to take the pair downwards, there is potential minor support at 1.3900 followed by strong support at 1.3800. On the flip side, if the pair heads north side, we may see prior support at 1.4000 serve as resistance now. Let’s see what will happen next!
GBPUSD: 4-hour Chart

A 4-hour chart of GBP/USD is shown above. The movement of the pair has been very erratic for about a month already. It must have been a rollercoaster ride for position traders as the pair just moved sideways within a 400-500 pip trading range for the said period.
It made a false breakout last June 30. During that time, it appeared that the pair would head up since it managed to close above the psychological 1.6600 resistance and even made a new high in 8 months.Unfortunately, the pair made a quick sharp u-turn and found itself within the range again. The pair has weakened for the most part of this week and is now approaching the bottom weekly ATR.
It might continue to head a little lower until it finds support around the psychological 1.6300 mark, lower weekly ATR, or the 1.6200 psychological level. Support looks to be solid in those levels. So if the pair find one, it might turn up until it encounters resistance. The nearest resistance for the pair would be the 1.6400 mark.
AUDUSD: 1-hour Chart
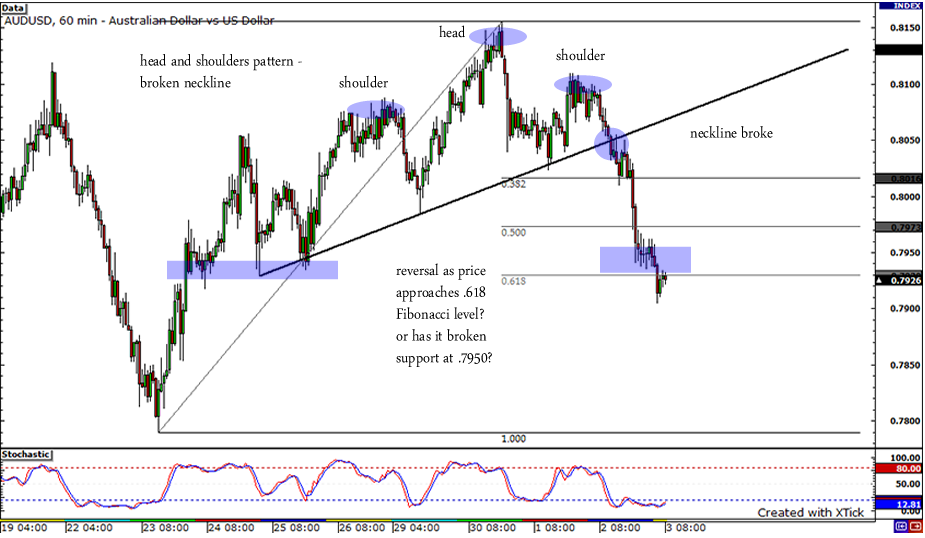
Take a look at the recent activity of the AUDUSD pair. Shown above is a 1-hr chart of AUDUSD. The pair had recently formed an ascending head and shoulders pattern, but the neckline support broke early yesterday.
Risk aversion continued to push the dollar, as price action has been dropping since. Right now, price is approaching the .618 Fibonacci retracement level, but has broken past support at .7950 as well breaking previous lows. Will price action continue it downward trend? Or are the sellers done and could we see a reversal?


