


USDCAD: Daily Chart
A daily chart of USD/CAD is shown above. Price action of the pair shows that it wasn’t able to break past the resistance around the 1.1650 region yesterday. It was too tough to pierce for buyers as this price level coincides with the previous week’s high, falling trend line and 38.2% Fibonacci level.

With stochastics indicating overbought conditions, sellers took the price back down to 1.1500 forming a bearish engulfing candle.
If the recent rally was just a retracement on the longer time frame, the pair’s next targets would be previous support at the psychological price level of 1.1400. On the flip side, a break on the falling trend line could take the pair all way to 1.1700 and beyond.
EURJPY: Daily Chart
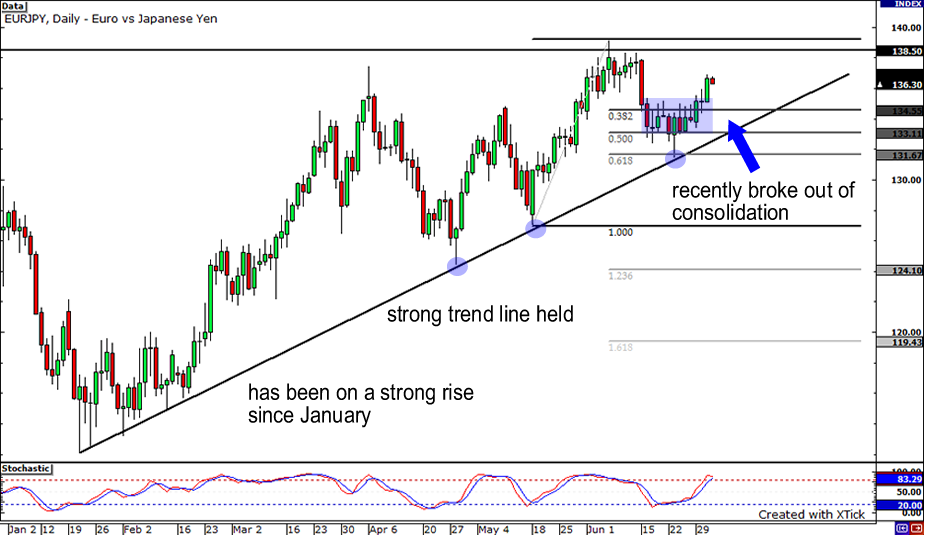
A daily chart of EUR/JPY is shown above. The pair has been on a steady rise since last January, although it seems to have lost some steam in recent weeks. There seems to be strong resistance around the 138.50 area but there appears to be an ascending triangle forming as the strong uptrend line has held.
Price most recently bounced off the trendline when it coincided with the .618 Fibonacci retracement level at 131.67. Right now, price action has just broken out of a consolidation period the last 2 weeks and we are seeing a bullish green candle. This could be a signal that the pair may continue to rise and test the prior resistance at 138.50USDJPY: 4-hour Chart

Check out the 4-hour chart of USD/JPY shown above! The pair rallied after bouncing a couple of times from support at the 95.00 area. Its rally was ended as it closed in on a psychologically significant resistance level at 97.00.
It looks like it’s staging another attempt to hit this level and possibly pierce through. However, a descending trendline can be drawn connecting the highs of the price, implying that the pair may encounter more resistance before heading higher. Stochastics are also in overbought territory, which means that additional selling pressure is brewing.


