


USDCHF
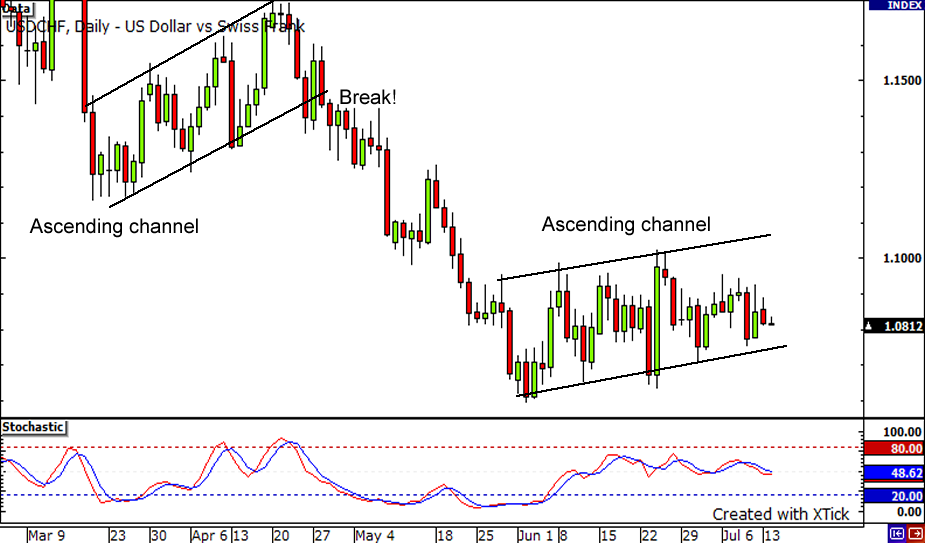
Check out the channels on the USD/CHF daily chart! The pair formed an ascending channel from early March until the end of April right after a sharp dive. This formation, known as a bearish flag, signals that another price drop is due. And look how the pair came tumbling down after it broke below the support of the channel… that’s a 400-pip high drop right there! The pair is currently in a new ascending channel, which was formed at the start of June. Is the pair revving up for another high dive? The stochastic is currently in the neutral zone, which means that buying and selling pressures are almost equal. The price is sitting on the lower half of the channel. It could rise and hit the ceiling at the top of the channel or it could break the support yet again.
USDCAD
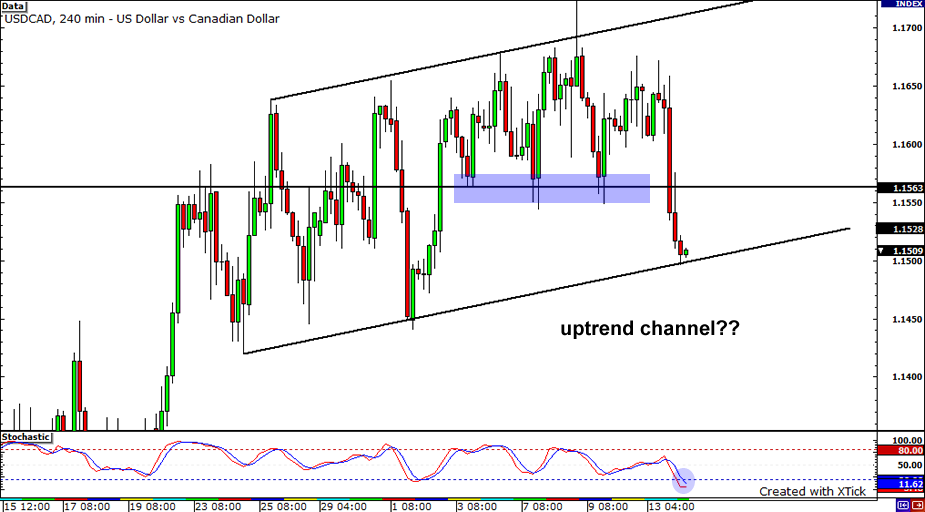
Here’s another channel on the four-hour USDCAD pair! The pair dove yesterday, breaking the support at 1.1550. Now price action has stalled around the psychologically significant 1.1500 price level, which nicely coincides with the bottom of the uptrend channel. Stochastic is indicating that the pair might now be oversold so there is the possibility that it might retest 1.1550 once again! If it pierces through that, it might just go all the way at the top of the channel, around the 1.1700 region. On the other hand, if it chooses to head further downside, its next target would be minor support at 1.1450. A stronger support could be found right after that, at 1.1400, a round juicy psychological number!
AUDUSD
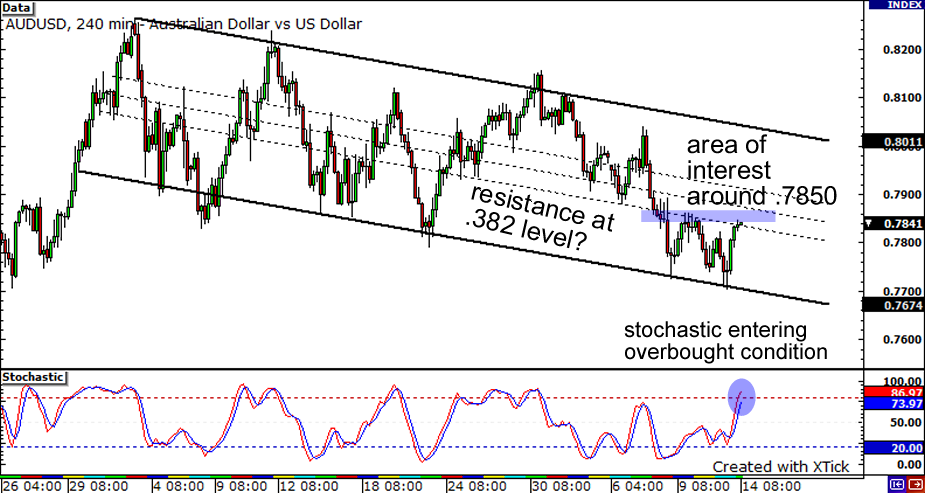
Last week, I pointed out that the AUDUSD pair is staying within a descending channel. Yesterday, it hit the bottom of the channel, bounced and reversed up! It appears that this line has been holding well, as price action has repeatedly bumped off of it. The pair is now approaching potential resistance as it approaches the .382 Fibonacci retracement level, which held for the majority of last week. Also, this price action is near the .7850 price level and stochastic is showing overbought conditions. Will the pair bust past resistance and proceed to hit highs at the top of the channel? Or will it change course and head to the downside?


