


USDCHF
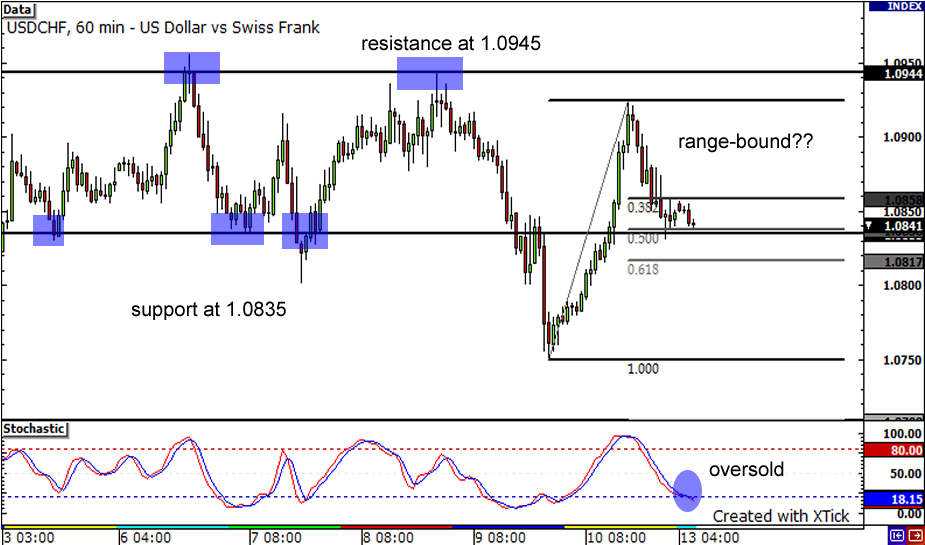
Last Friday’s USD rally drove the USD/CHF back to jail at its 1.0835 to 1.0945 range. Could this pair resume a range-bound movement for the rest of the week? The price is currently lingering at the bottom of the range, near support at 1.0835. Drawing a Fibonacci retracement tool from Thursday’s low to Friday’s high, it can be seen that the 50% retracement level lines up nicely with the support area. Also, the stochastics is tiptoeing towards the oversold region, which suggests that buying pressure is mounting and that an upward movement in price is due. If the pair takes the northbound route, it could find a couple of roadblocks along the way. First, there could be resistance at the psychologically significant 1.0900 mark. Further along, another barrier is located at the top of the range at 1.0945. On the other hand, if the pair breaks below support at 1.0835, it has another shot at retracement on the 61.8% Fibonacci or at 1.0817. It could also find support at 1.0800 handle, which is a psychological support level.
EURJPY
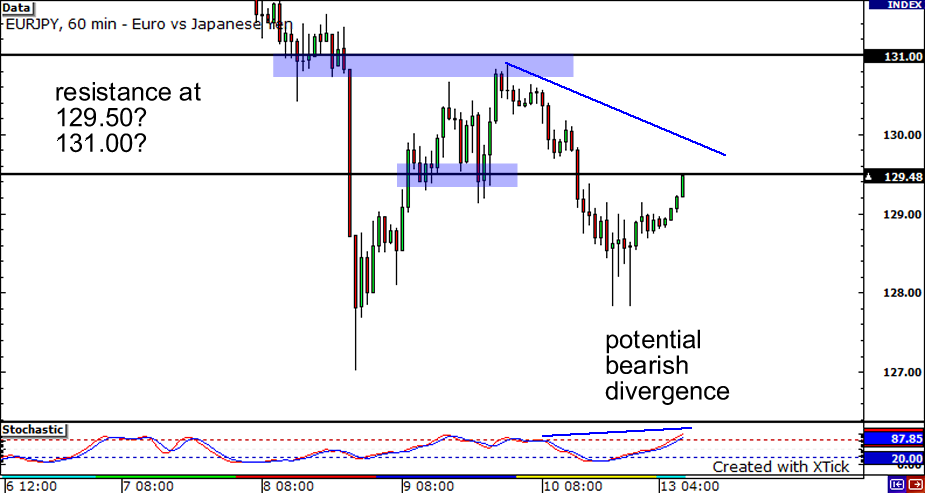
Last week was a douzy for the EURJPY pair, as we saw it drop almost 500 pips! The strongest move came Late on Wednesday, when we saw the yen gain across the board. In the process, we saw the EURJPY pair drop 200+ pips in just over a couple of hours! After that, we saw a bit of retracement, as the pair rose close to 131.00 before dropping again. Are we in line for another move to the downside? The pair is coming upon an area of interest at 129.50, with further resistance once again at 131.00. The pair is also showing potential for bearish divergence. With recent sentiment shifting towards risk aversion, we may see sellers help bring this pair back down within the week.
EURUSD
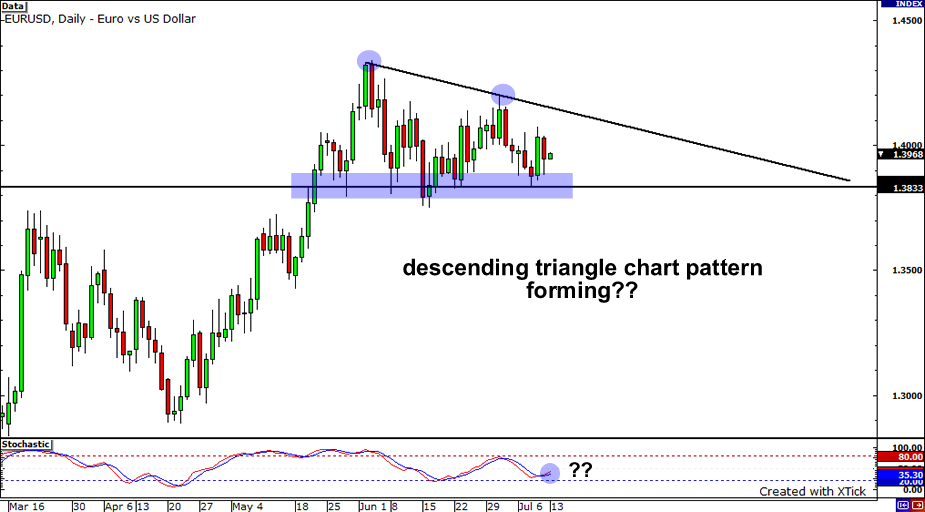
Is that a descending triangle forming on the EURUSD daily chart? It seems that sellers have the upper-hand as the descending trend line resistance of the triangle begin to form. Still, buyers refuse to give up the key technical and psychological support level at 1.3800. This price level, which has provided support since mid May, remains unbroken up to now! If the pair’s ranging behavior continues to persist, we may see further consolidation at the tip of the triangle as the week goes by. In the event that 1.3800 breaks, a follow through towards 1.3700 and even towards 1.3600 is probably. On the other hand, if 1.3800 holds, the pair would most likely move sideways with 1.4000 serving as resistance.


