


EURUSD: 4-hour
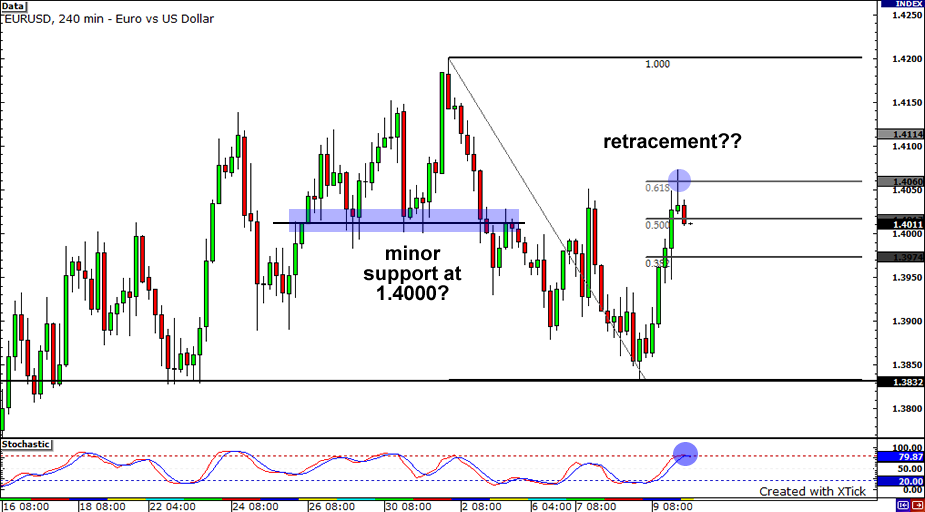
Yesterday the EURUSD rallied and took out numerous resistance levels. The question is whether the sharp rise was merely a retracement or a reversal of the recent downward trend. Looking at the four-hour chart, price action seems to have bounced at the 61.8% Fibonacci level (1.4060) and is now showing signs of reversal. Notice the long-wicked candle followed by a bearish red candle. With stochastic indicating that the pair might be overbought, will we see the pair head downside once again? If this is the case, it will face some minor support around the psychological price level at 1.4000. Conversely, if it continues to head north, resistance could be found around the 1.4100 key technical and psychological resistance level.
AUDUSD: 4-hour
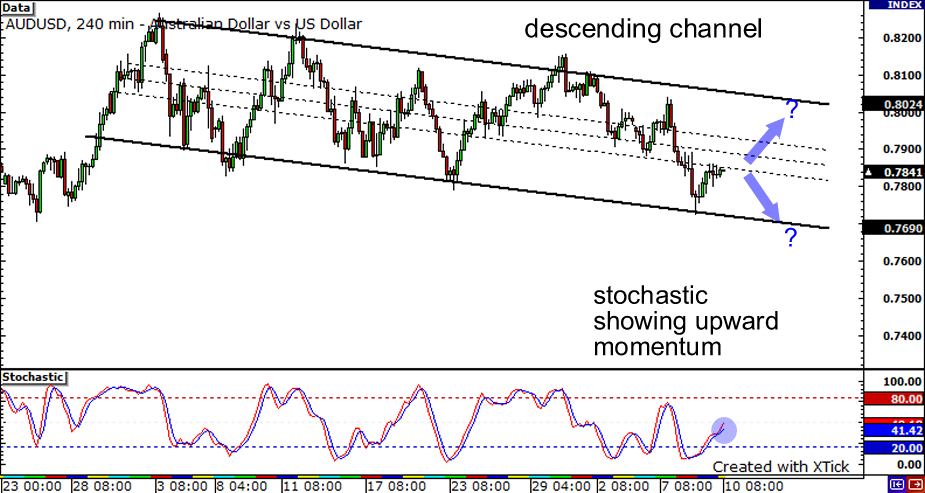
After the strong run by stocks and commodities we saw in March through May, we have seen a cool off since the start of summer for the AUDUSD pair. The pair has been on a descending channel the past 5 weeks after hitting a high on June 3. The pair has proceeded to trade within a channel and for the most part, respected previous highs while making lower lows. The pair has seen a retracement after the strong dollar rally we saw the past week and is now hitting a resistance point at .7850. Will we see the pair continue to test higher, possibly hitting further resistance at .8000? With stochastic showing upward momentum, there is room for further retracement. Could the pair shoot down and hit support at .7900?
GBPUSD: 1-hour

A 60-minute chart of GBP/USD is shown above. The GBP recovered some of its losses this week as it looks to retrace back to its 50% Fibonacci retracement level yesterday using the high on June 30 as a swing high and the low on July 6 as a swing low. If the price sees this level as a resistance, it might turn down already until it finds support at 1.62, 1.61, the weekly low atr, or the weekly low. On the other hand, it can still continue its general retracement up to 1.64, the 61.8% Fibonacci retracement level, or at 1.65.


