


EURJPY: 4-hour
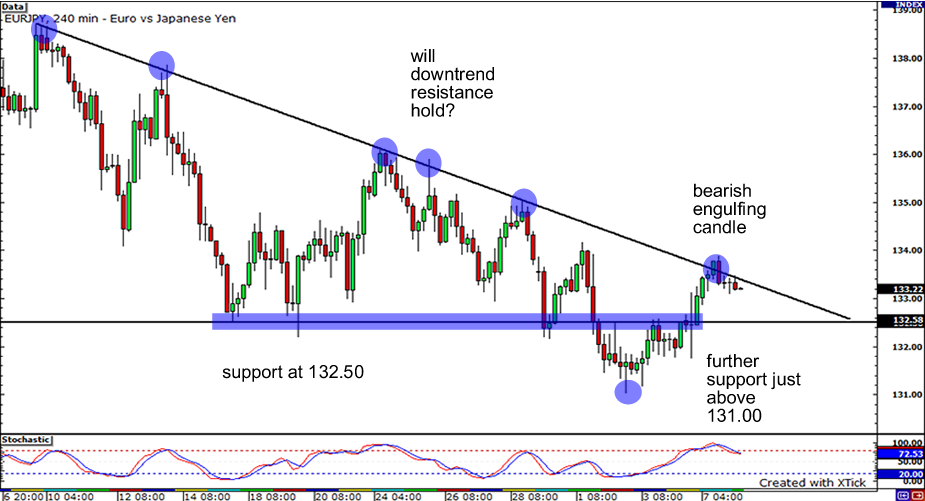
Looks like the EURJPY is still following the downtrend line that I pointed out last week! The pair tested the downtrend resistance, but couldn’t break through as buyers could push the pair any higher. With stochastic just exiting overbought conditions, will there be enough momentum from sellers to push the pair down? The 4-hour chart shows a bearish engulfing candle along with a couple of dojis, indicating that the recent upmove may be coming to an end. If the pair does shoot down, it could find support at 132.50 or at 131.00. If however, the pair breaks the downtrend resistance, it could find resistance at previous highs at 135.00 and 136.00.
USDJPY: 4-hour
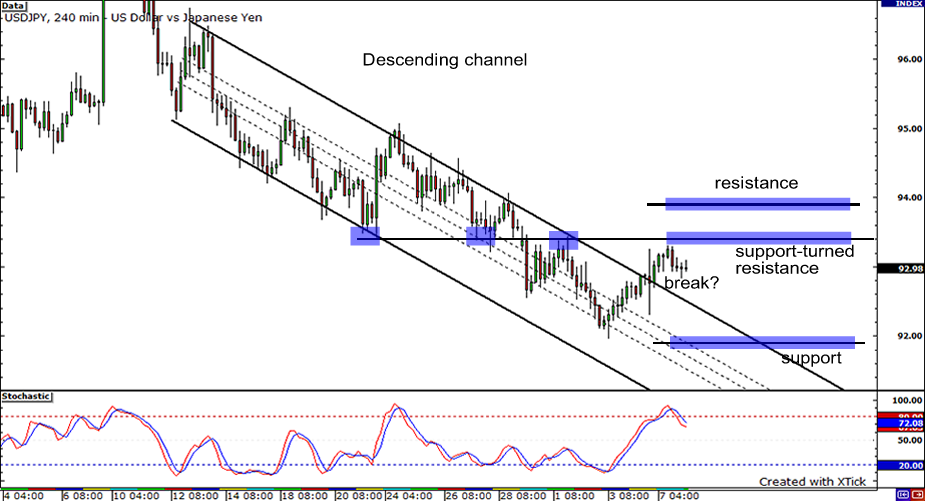
Now let’s head on over to an update of the USDJPY price action… That looks like a nice clean break from the descending channel on the 4-hour chart but we’ll have to wait and see whether the pair drops back in the channel. The pair just surged past the psychological resistance at 93.00 and encountered another blockade at 93.50, which is a support-turned-resistance level. If the pair continues to slide down, it could find psychological support at 92.00, which is in line with the pair’s previous low. On the other hand, if it breaks above 93.50, it could reverse upon hitting the psychologically significant 94.00 mark.
GBPUSD: 1-hour

And finally, an update on the GBPUSD. As can be seen, the psychological 1.6400 support yesterday did not hold. As a result, the pair fell sharply and is now trading just below 1.6350. This level may act as a minor resistance that can prevent the price from heading up in the meantime. If the pair drops down further, it can find support at 1.6300. On the other hand, if buyers take over, we could see a retest of the 1.6400 handle.


