


EURCHF: 1-hr
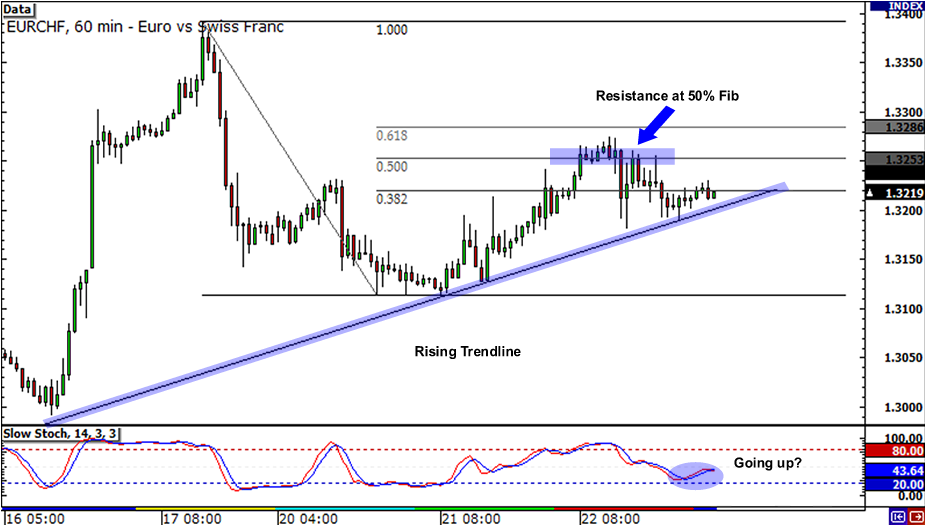
Rise and shine, my forex geeks! Time to wake up to a rising trendline! The pair is currently tapping the trendline on the one-hour chart, and it looks like stochastics is also saying “aye” to an upward movement. But be careful of the good-looking Fib line! The resistance at the 50% Fib looks just as promising! I’m seeing 1.3350 as a sweet spot for the bulls’ profits, with a stop loss just below the trendline.
USDJPY: 4-hour
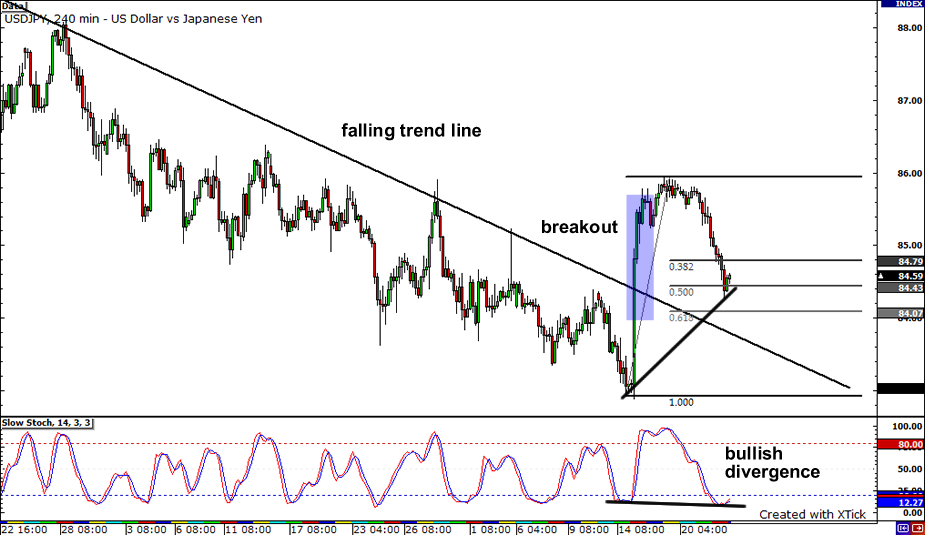
Is USDJPY ready for a bounce? After making a strong breakout above that falling trend line, the pair’s rally seems to be losing steam. But, wait a minute, am I seeing higher lows from the price and lower lows from the stochastics? Well, that’s a bullish divergence right there! This suggests that the pair’s upward movement could resume, possibly after it retests the broken trend line. USDJPY seemed to find support at the 50% retracement level but if it pulls back a little further, it could bounce upon hitting the 61.8% Fib.
AUDUSD: Daily
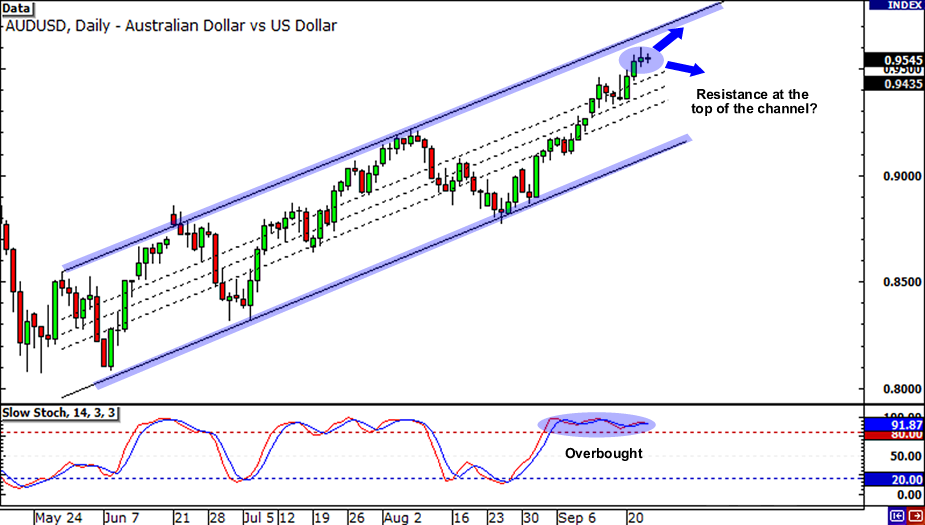
After rocking the charts for days in a row, is the Aussie in for a fall against the dollar? The pair is playing around the top of the channel on the daily chart, and it looks like momentum is running out for the pair. Hmm, stochastics is also pointing an overbought signal, but then it has been that way for a while. Will the Aussie extend its gains, or will it follow the pattern like a good little kid? Better watch this one closely! A candle closing below 0.9350 just might be what we need for a confirmation of a fall!


