


USDCHF: 1-hour
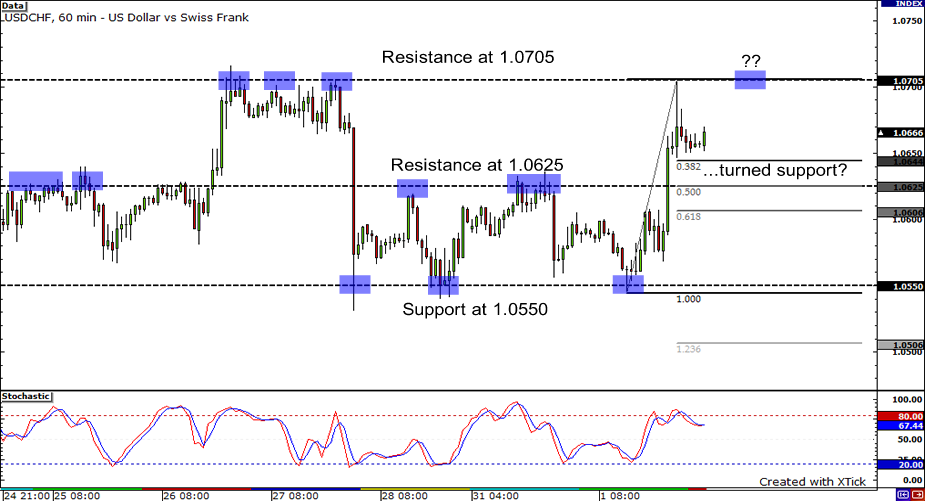
Now there’s a nice clean break by the USDCHF! For the past few days, the pair’s movement has been range-bound as it found support at 1.0550 and resistance at 1.0625. Just yesterday, it pierced through the resistance level, which could now serve as support. This level lines up nicely with the 50% Fibonacci retracement level, implying that the pair could rebound from there. If you check out the last time the pair broke above resistance at 1.0625, it traded much higher and found resistance at 1.0705. Currently, the stochastic is still showing some intention of climbing up, which means that the price could rise and again encounter resistance at 1.0705.
NZDUSD: 1-hour
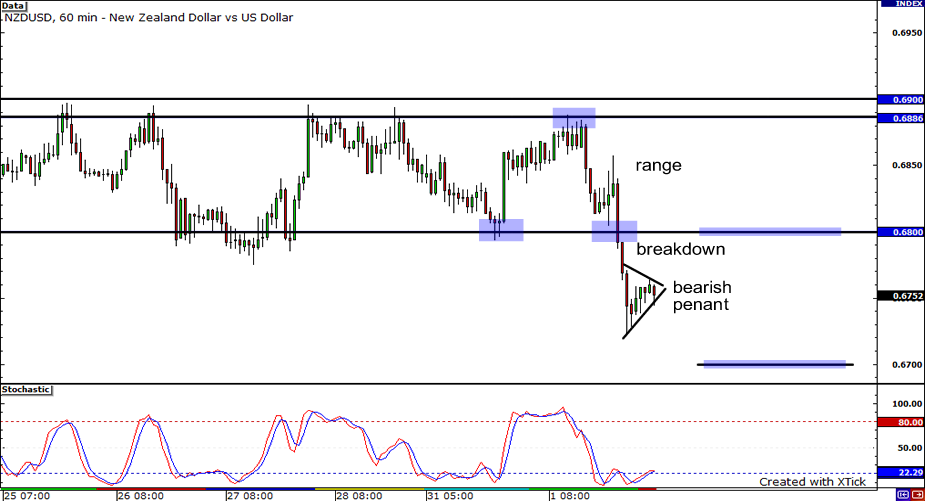
Here’s an update on the the previous chart that I drew for the NZD/USD pair! After respecting both the support and the resistance of its trading range, the support finally gave way which caused the price to fall in a very fast and steep manner. The pair is currently taking a pause after breaking down from its consolidation. It appears that the pair is making a bearish pennant pattern. Given the formation’s downside bias, the price could slide down further if it breaks down from the pattern and closes below 0.6752. The pair could find itself all the way down to 0.6700 if it does. Conversely, the pair may spring back up to 0.6800 if it manages to stay above 0.6750.
EURJPY: Daily

A couple of days ago, I also showed you a chart of the EURJPY. Well, the pair has just broken past a key support level at 133.00, the former neckline. The pair has now touched the .618 Fibonacci retracement level, which lines up at 131.50. Will the pair retrace? Stochastic is showing that the pair is in oversold territory. On the other hand, if it does break through 131.50, could the pair shoot all the way down to test psychological support at 130.00?


