


GBPUSD: 1-hour
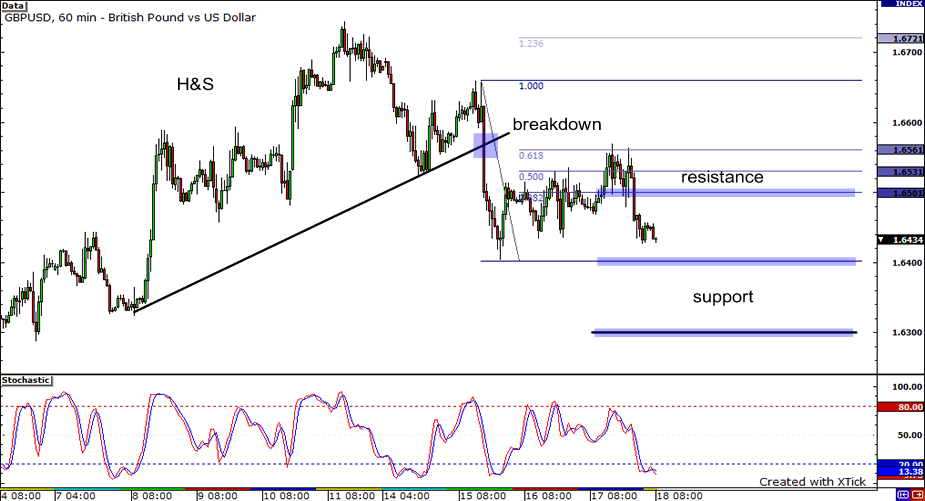
Let’s start with an update of a pair I recently did – the GBPUSD. It looks like the pair rallied back to its 61.8% Fibonacci level after breaking down from a head and shoulders pattern. Interestingly, this level coincides with the psychological 1.6500 mark. The pair is moving back down again after hitting the mentioned level. This descent may be put to a halt by the 1.6400 handle. If it holds, then the pair may shoot back up to 1.6500. On the other hand, it could fall even further to 1.6300 if 1.6400 breaks.
EURJPY: 4-hour

Now let’s move on and take a look at the exciting EURJPY! Over the past couple of weeks, we’ve seen the pair dip twice, only for buyers to push the pair back up. Right now, the pair seems poised to head back down. It appears to be displaying signs of bearish divergence, as price has been forming higher highs while stochastic is showing lower highs. Not to mention, a group of doji’s are dancing right now at the top of a recent upmove – could this be signal of a reversal? If sellers do decide to push the pair back down, look for support around 133.00, a previous area of interest and at 132.00, just before the previous low. If however, buyers still feel like hanging around, we could see the pair spike back up to the topside and test previous highs at 135.00 and 136.00.
USDJPY: Daily
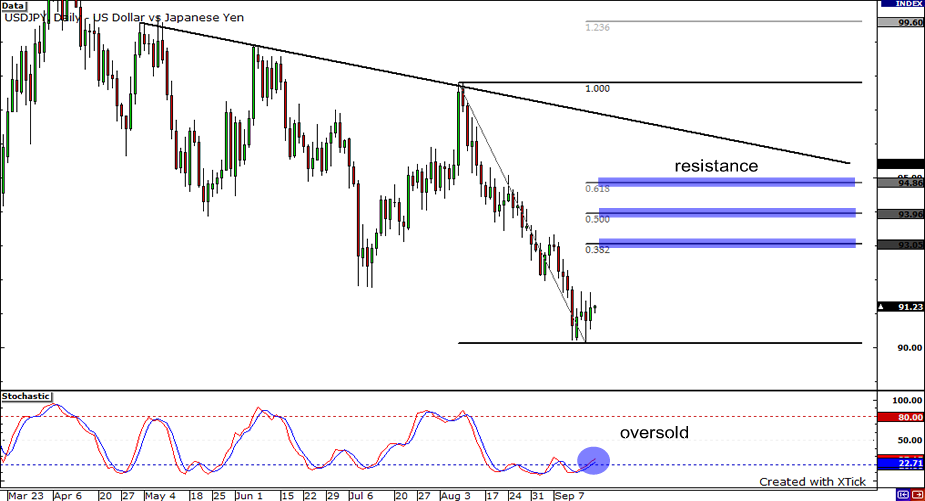
The USDJPY has been trending lower for quite a while now… On the daily chart, a descending trend line can be drawn connecting the highs of the pair. Upon hitting the trend line at the start of August, the pair tumbled all the way down to a low of 90.12. Right now, the stochastic is climbing out of the oversold region, which means that the price could climb up as well. On its way up, the pair could encounter resistance at any of the Fibonacci retracement levels. Each of these levels are in line with nice, round, psychologically significant numbers: 93.00, 94.00, and 95.00. What a coincidence! But if the pair ignores these resistance levels, the upward price action could reverse again upon hitting the trend line.


