


EURUSD: 1-hour
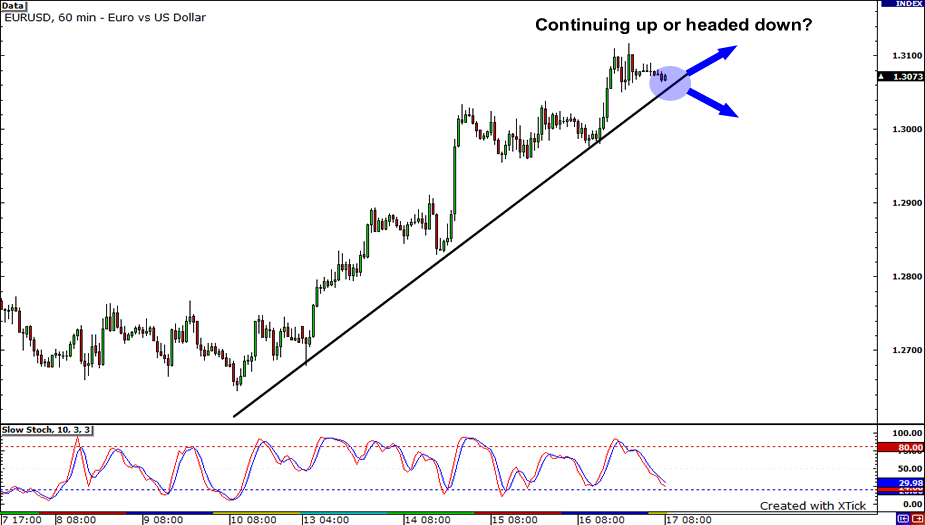
No better way to end your week than with an ascending trend line, don’t you think? EURUSD has been on the rise as of late, but right now, it seems to be taking a breather. Maybe it’s deciding where to go! It can either continue climbing up the charts and create a new weekly high, or it can head the other direction. Something tells me that if it does turn around and move south, it may find support at 1.2960 again.
GBPUSD: 4-hour

Uh oh, it looks like GBPUSD bulls are in trouble! With GBPUSD forming a nice bullish flag pattern after making new monthly highs, it seems that the bulls are simply revving up for a strong rally. Remember, bullish flag patterns usually occur because price rarely moves in a straight line for an extended period. Instead, traders tend to rest and take a break before making their move again. That being said, keep a close eye on resistance at the 1.5650 level, because a candle close above it will open the way to 1.5800 for the bulls!
NZDUSD: 4-hour

I just love the way Fibonacci retracement levels work. I mean, check out that neat little setup on NZDUSD! The pair seems to be finding support at the 38.2% Fib as stochastics has been treading in oversold territory. Not only that, but price has been making higher lows while stochastics has been making lower lows. You know what that spells… A bullish divergence! If buyers boost the pair up, we might see it retest the .7400 handle. But if sellers take control, NZDUSD could end up at the 50% and 61.8% Fib levels.


