


EURJPY: 4-hour
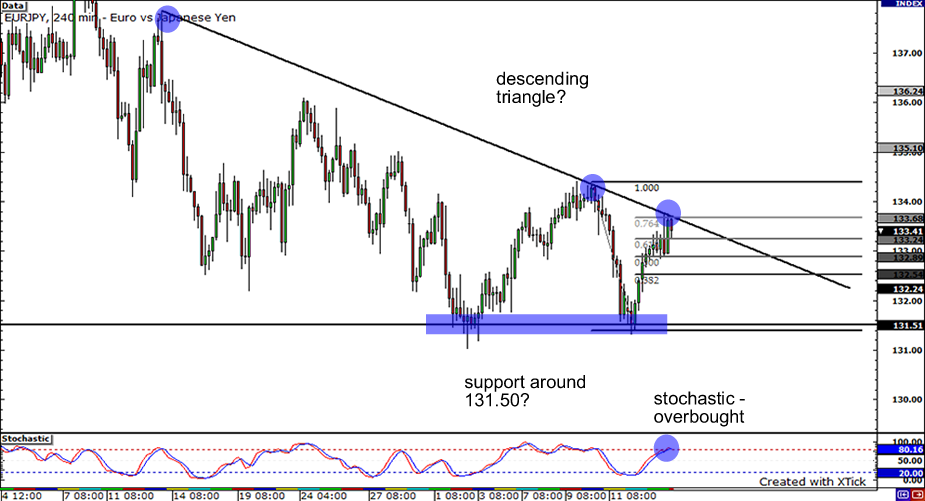
As usual, we’ve been seeing some pretty volatile movement from the EURJPY pair. As it is, the pair seems to be forming a descending triangle, as the pair is currently making lower highs and respecting the downtrend line. At the same time, some support can be found around the 131.50 area. With stochastic showing overbought conditions and price just bumping off the .764 Fibonacci retracement level and downtrend line, could we see the pair head to the downside? If sellers do succeed and put an axe to the recent up move, we could see price tumble down and test support at 131.50. If however, buyers find more strength and push the pair up, it could break past the downtrend line and perhaps test previous highs around 134.50 and 135.00.
USDCAD: Daily
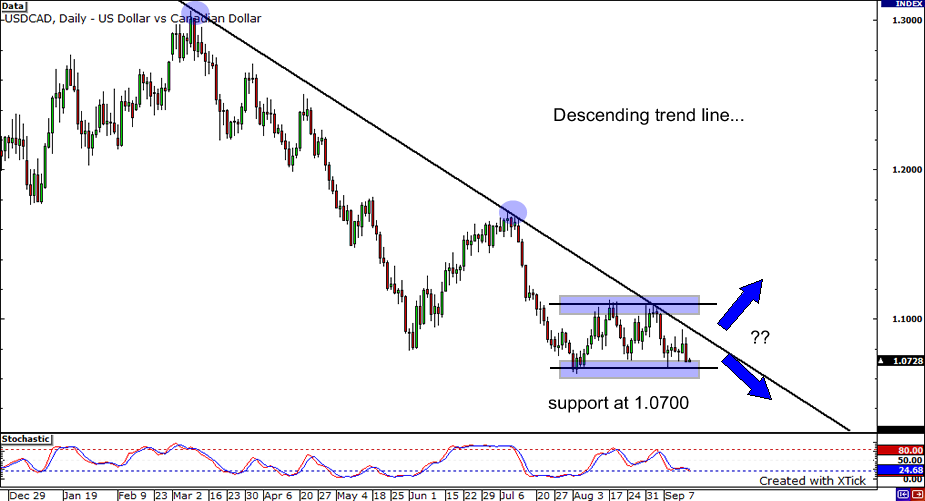
Now onto the USDCAD daily chart… As you can see, the pair is in a very obvious downtrend. Notice how the formation of a descending trend line when I connected the tops of lower highs. It seems that sellers are attempting to push the pair lower towards support at the 1.0650-1.0700. If sellers continue to control the pair and break support, the pair could head all the way to 1.0500, the next psychological support level. On the flip side, if the pair bounces and heads top, we could see the pair retest previous resistance at 1.0900 and 1.1000 respectively.
GBPUSD: 1-hour
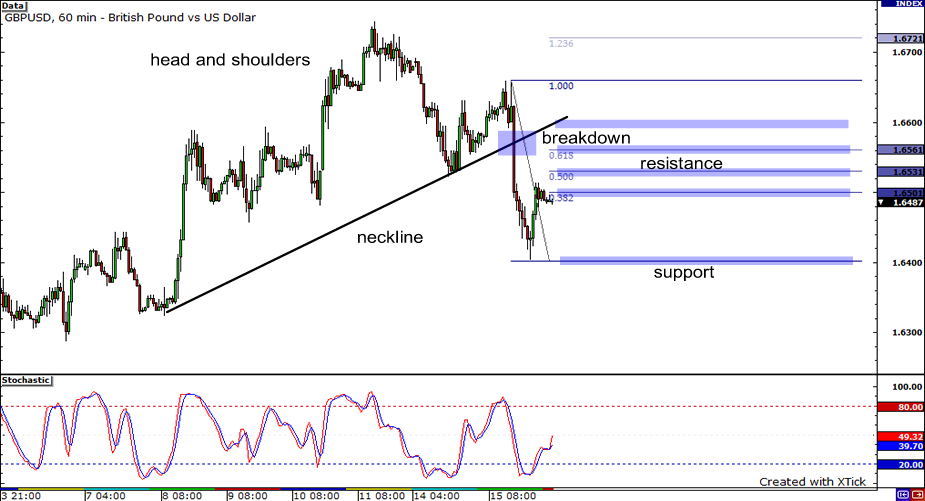
I didn’t know that P&G would think out-of-the-box and plug their product in the currency market but they did! A head-and-shoulders pattern with an upward slanting neckline appeared in the cable’s 60-minute chart. Due to a massive selling pressure, consumers ran like crazy and sold off the pound. Eventually, a lot of buyers saw it as a bargain at 1.6400. Currently, the price is retracing back to its 38.2% Fibonacci level, which also falls in line with the psychological 1.6500 mark. The pair may see this level as a resistance that could again push the price back down to 1.6400. But if demand remains, ‘retailers’ can then chalk up the price all the way to 1.6600.


