


USDJPY
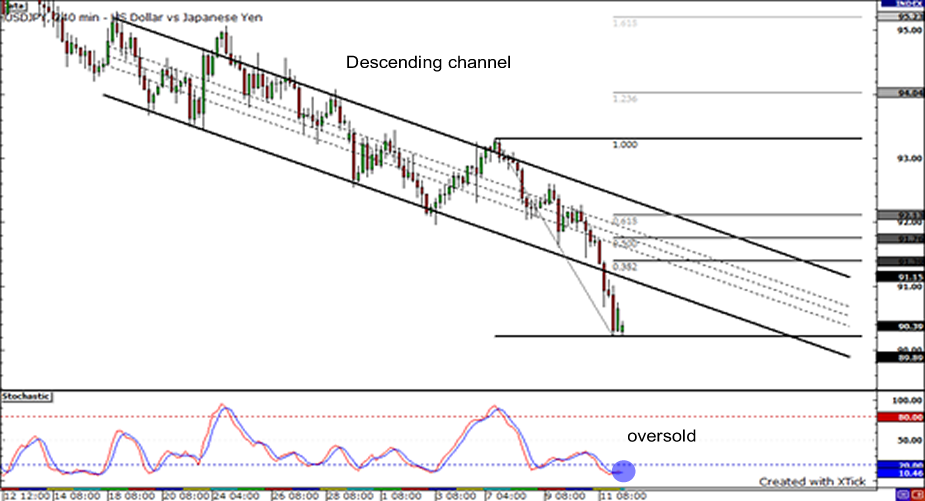
Check out the USDJPY’s nice clean break from the descending channel! The pair cut through the psychologically significant 91.00 level before it proceeded to breach the channel’s support with those long red candles. The pair reached a low of 90.21, which could serve as support if the downward action continues. But with the stochastics in oversold territory, some upward price action could be expected. The pair could retrace up to the bottom of the channel, which is very near the 38.2% Fibonacci retracement level. Or it could go up a little further and land back inside the descending channel.
EURJPY: 4-hour

Yowza! The EURJPY ended last week with a steep drop, falling over 200 pips over the last few days of the trading week. The pair is now headed towards the September low, just a few pips ahead of the 131.00 price level. With stochastics indicating oversold conditions, perhaps we will see buyers sharpen their swords and go to battle. If they come out slicing and dicing, let’s see if the can overcome resistance at 132.50, a former area of interest. If they succeed, they might try to reach prior highs just below 134.50. If however, sellers come in dropping bombs, they might try to bowl over the monthly low. If they can keep up the momentum, they might just bring price action all the way down to psychological support at 133.00.
GBPUSD: 4-hour
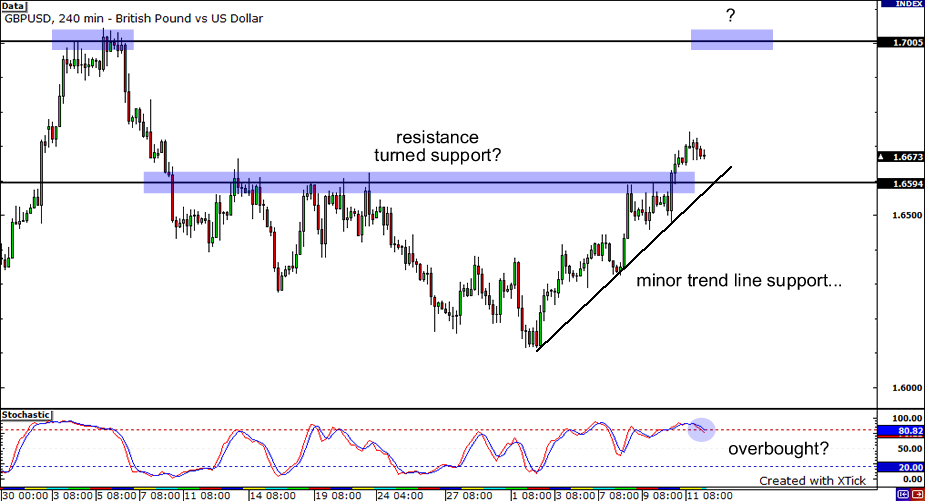
Let’s head on over to a dollar pair now… After weeks of falling, it seems like buyers have finally taken back control of the GBPUSD pair. Is this a start of a new trend upwards? Notice how the pair managed to pierce through resistance at 1.6600 and started forming higher highs while being supported by a rising trend line. If buyers continue to push the pair higher, 1.7000 looks like a realistic target. In addition, 1.7000 is a round, juicy, psychological number. On the flip side, stochastic is showing that the pair could be overbought. This means that the pair could retrace some of its steps, probably towards the rising trend line and resistance turned support at 1.6600.


