


EURUSD: 1-hour

It looks like EURUSD is starting to form a pretty obvious (and sexy) range on the 1-hour. As you can see, it was unable to pierce through the 38.2% Fibonacci retracement level twice already while it found some major support at the 1.2670-1.2680 area. Price is currently creeping its way back to former lows for a fourth test, so we could see a possible bounce. Still, be careful for a possible breakout! If you’re part of the bear camp, look for a convincing candle close below former lows to confirm a move lower!
USDCAD: Daily
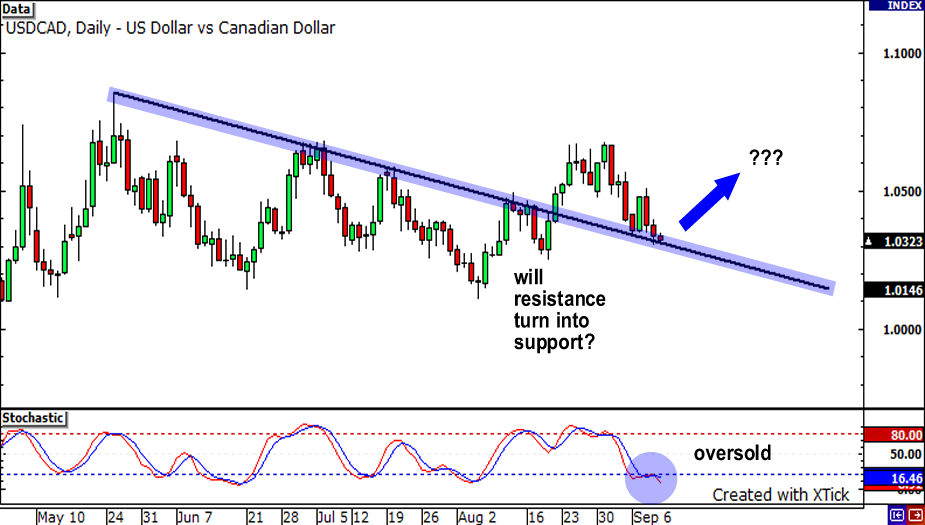
Next up, let’s bounce on over to the daily chart of USDCAD. After rising over the past two weeks, the pair has made a steep drop of over 350 pips. I wonder though, with the pair now approaching a former falling trendline, could this resistance level now act as support? With stochastics showing oversold conditions, sellers may not have enough momo (that’s momentum for y’all!) to overcome the potential trend line support. Buyers may just jump back in and push price back up to test recent highs at 1.0670.
NZDUSD: 1-hour
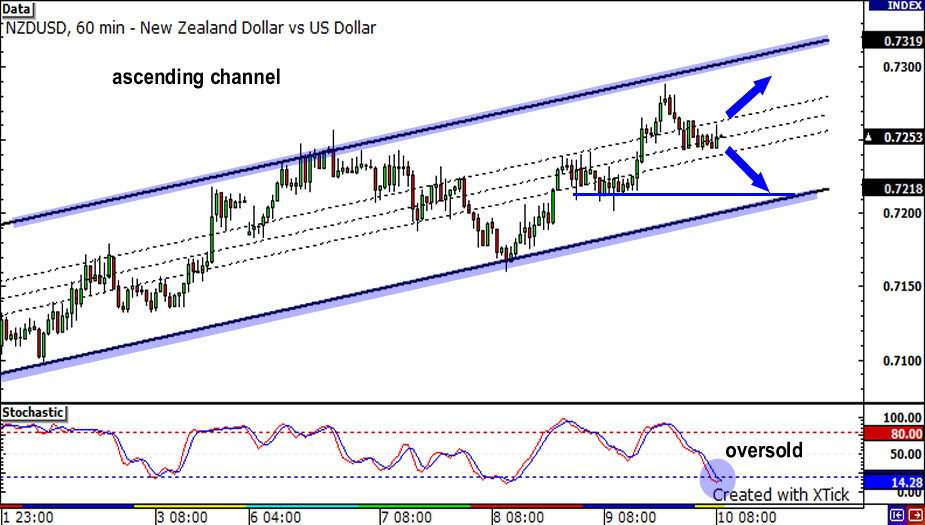
Last but most def’ not least, I’ve got a sweet chart of NZDUSD! The pair seems to be stuck trading within an ascending channel right now, but seems to be finding support right smack in the middle of it. Stochastics do indicate that this move may be over, as it is in oversold territory. The pair could reverse and head for new highs above .7300. On the other hand, if the pair does continue to trek lower, watch out for support at .7220, which would mark the bottom of the channel as well as a previous area of interest.


