


USDJPY: 1-hour
Check out the action on the USDJPY 1-hour chart… Bullish divergence, with the price drawing lower lows and the stochastics showing higher lows, correctly indicated that the pair would head up.
The pair has just retraced from the 50% Fibonacci level and is currently deciding which direction to take.
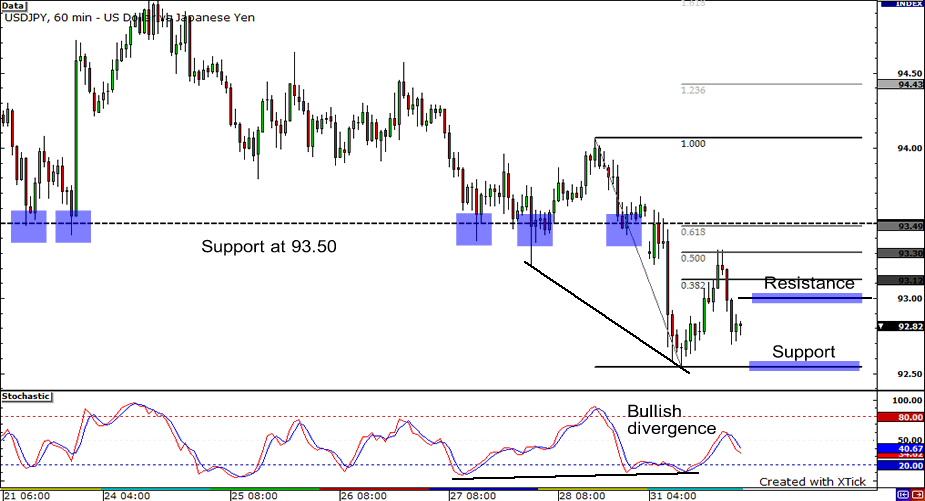
The stochastics is on neutral grounds, which means that the pair could take either the northbound or southbound route. Since the pair has been trending lower recently, there could be a slight southward bias.
Potential support is seen at the pair’s previous low of 92.54. If the pair heads north, it could encounter resistance at the psychologically significant 93.00 mark. Also, previous support at the 93.50 area could now serve as resistance.
USDCAD: 4-hour

It looks like an ascending channel has formed on the 4-hour USDCAD chart when price tested the previously broken trend line support for the third time yesterday.
Despite the pair’s run upwards, USDCAD buyers weren’t able to take the pair any much higher than 1.1000, a psychologically and technically significant price intact.
If the price continues to fall, the next potential support could be found on the bottom of the channel, possibly somewhere around 1.0900.If support breaks, another one could be found at the previous swing lows at 1.0800 and 1.0700 respectively. Conversely, if the price heads north again, a considerable amount of selling pressures could be found at 1.1000.
AUDUSD: 4-hour
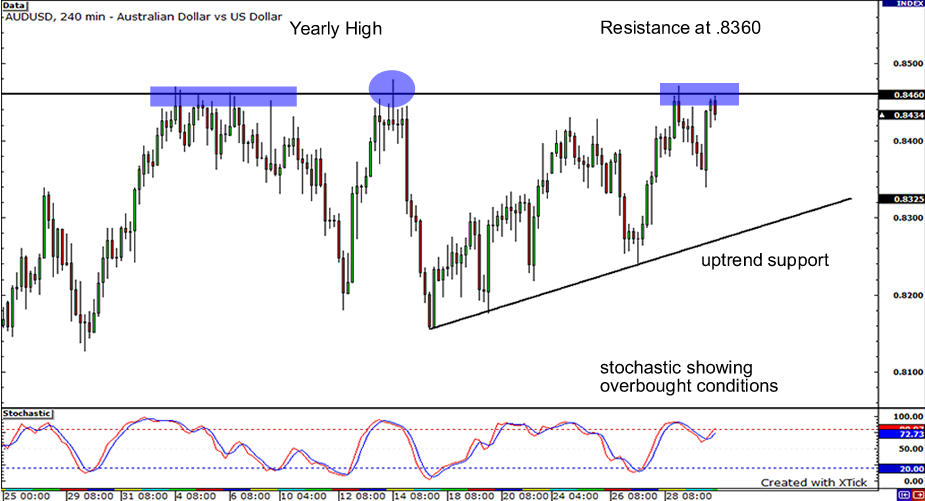
The AUDUSD pair has been in an uptrend as of late – will this continue as we enter a new month? The pair has been getting uptrend support from the recent trend line, but resistance at 0.8460 has been strong.
With stochastic showing overbought conditions, we may see the pair dip first and find support at around 0.8350.
If it breaks the trend line, it may find further support at 0.8200. Notice, however, that the pair seems to be forming an ascending triangle – could we be in line for a breakout?
Will the pair finally be able to set a new yearly high? If it does break to the top side, it may test the yearly high at .8479, and may find psychological resistance at 0.8500.
By the way, don’t forget to check out our other creations! Check them out and please, let us know what you think!


