


AUDUSD: Daily
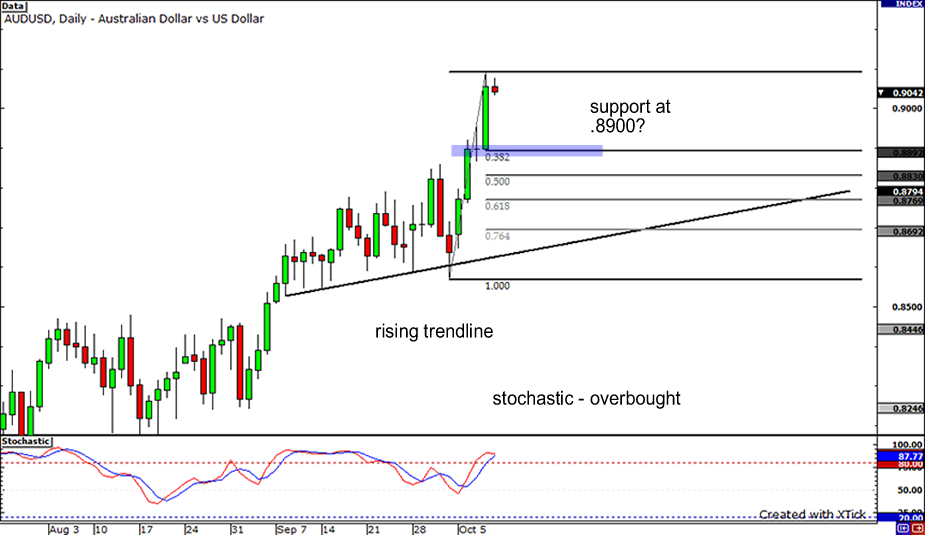
There’s no stopping the Aussie! The AUDUSD once again hit a new high for the year, touching at 0.9092. With stochastics showing overbought conditions, could buyers take a break? If sellers do bring in their A game, they could bring price back down to the 0.8900 price area, which seems to be a previous minor resistance point. It also lines up closely with the 38.2% Fibonacci retracement level. The pair could also find more support near the 61.8% Fibonacci level, at 0.8780, and at 0.8700, which will intersect the rising trend line. On the other hand, if buying is still in the cards, price action may bust pass through the 0.9100 handle, and possibly test for new highs around 0.9200.
USDJPY: 4-Hour
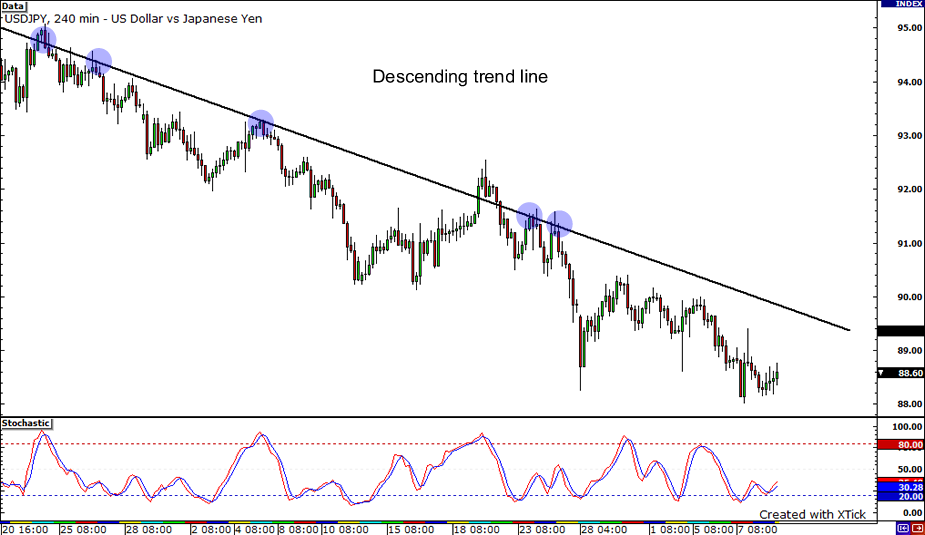
Let’s take a look at how things are going in the USDJPY 4-hour chart… The pair has been on a downtrend for quite a while now and a descending trend line can be drawn connecting the highs of the pair. Right now, the stochastics seem ready to climb out of the oversold area, suggesting that upward price movement could take place. If it does, the pair could move all the way up and retest the descending trend line. Who knows if the USDJPY will be able to break it this time? However, there seems to be some psychological resistance at 90.00. But if the pair heads down, it might find support at the previous low of 88.15 or at the psychologically significant 88.00 level.
USDCAD: Daily
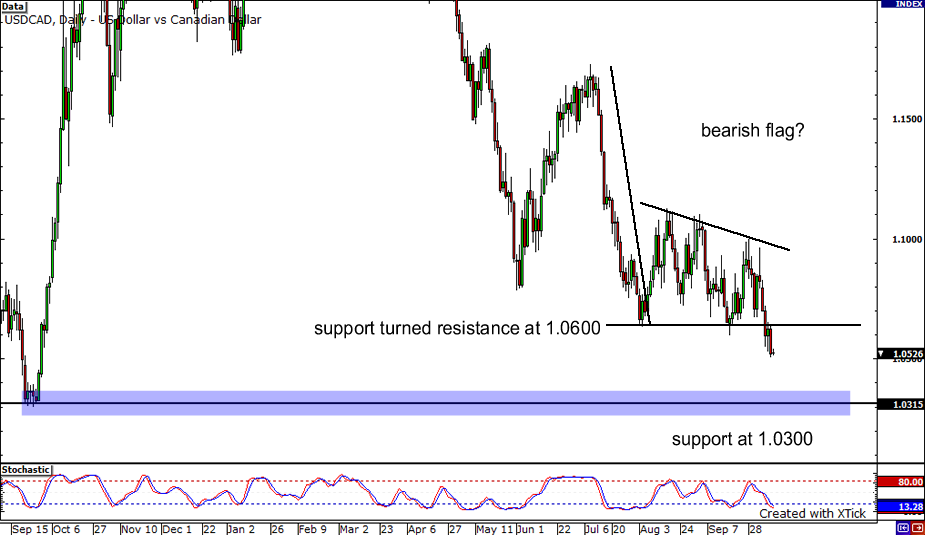
How low is it going to go? I don’t know but we all know it’s not nice to stand in front of speeding truck… If you’re sick of my corny metaphors, I’m talking about the USDCAD which has consistently made new yearly lows week after week. Now, there’s a bearish flag chart pattern that popped out in the daily chart after the pair’s sharp drop last July. Notice how the pair consolidated and bounced around a channel from August to September. From the looks of it, if the flag breaks to the south, sellers could push the pair all the way to 1.0300 before encountering buying support. On the other hand, if the pair heads north, resistance could be found at 1.0600.


