


Let’s begin with my coverage of the AUDJPY pair.
As can be seen from its 1-hour chart above, the pair’s descent was halted by the 81.00 handle.
It actually sprung back to 82.00 before it got another boost.. a super boost that was.

The pair skyrocketed by about 200 pips in just a couple of hours when the US’s economy during the third quarter expanded by 3.5%, more than the initial 3.2% estimate.
It eventually found some resistance at the 84.00 mark.
Currently, it is trading just above 83.50. It might do so for a while since its Stochastic are already in the overbought level.
If 83.50 holds, then the pair could fall down to 83.00. On the other hand, it could rise all the way to the resistance at 84.85 if it can move past 84.00.
USDCHF: 1-hour
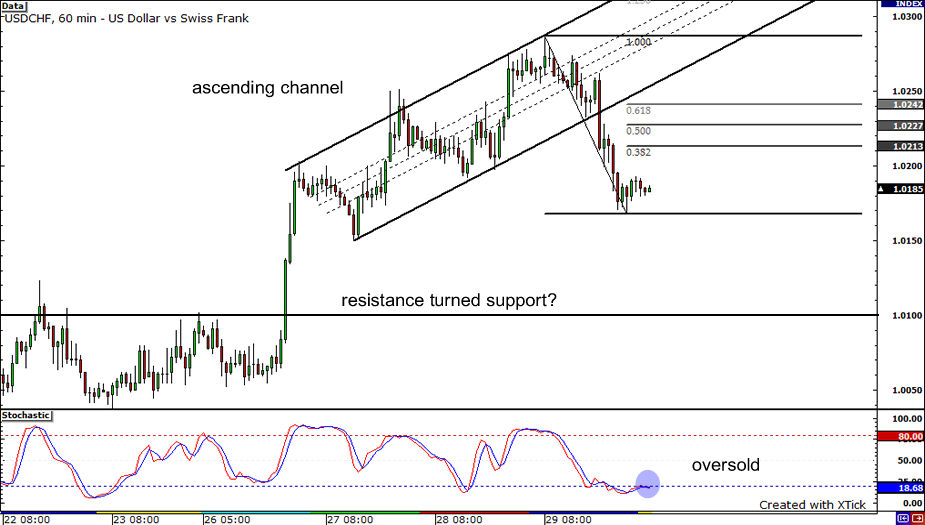
After moving in an ascending channel for a few days, the USDCHF pair broke below the bottom of the channel and fell to a low of 1.0168.
Stochastic looks ready to climb out of the oversold area, suggesting that upward price action could take place soon.
The pair could rise all the way up to the 61.8% Fibonacci retracement level, which is close to the bottom of the channel. If the upward momentum is too strong, the pair could land back in the ascending channel.
On the other hand, if the pair’s previous low at 1.0168 fails to serve as support for the pair, it could fall further and find support at the previous resistance at 1.0100.
EURUSD: 1-hour

Next is the EURUSD pair on its 1-hour chart. After falling for 4 straight days, the pair finally got its groove back.
Buoyed by the positive GDP report in the US, the pair rose from 1.4700 to 1.4850.
Presently, it is trading just below 1.4850. It can reach 1.4900 or even the resistance at 1.4929 if it can clearly close above 1.4850.
However, the pair could take a breather for awhile and fall to 1.4800 since Stochastic is indicating that conditions are already overbought.


