


AUDUSD: 1-hour

After making a recent head and shoulder pattern, the pair has broken down to the downside and has even hit lower than the 0.9000 price level. Now, with stochastics showing oversold conditions, we may see buyers try to enter the market once again. If they manage to gain some momentum, we could see them push price back up to around the 0.9115 area, where they could find some resistance as it has been an area of interest in the past and right now lines up with the 0.618 Fibonacci retracement level. However, if sellers decide to stick around, they could bring price down to test the 0.8900 handle and previous resistance at 0.8850.
GBPJPY: 1-hour
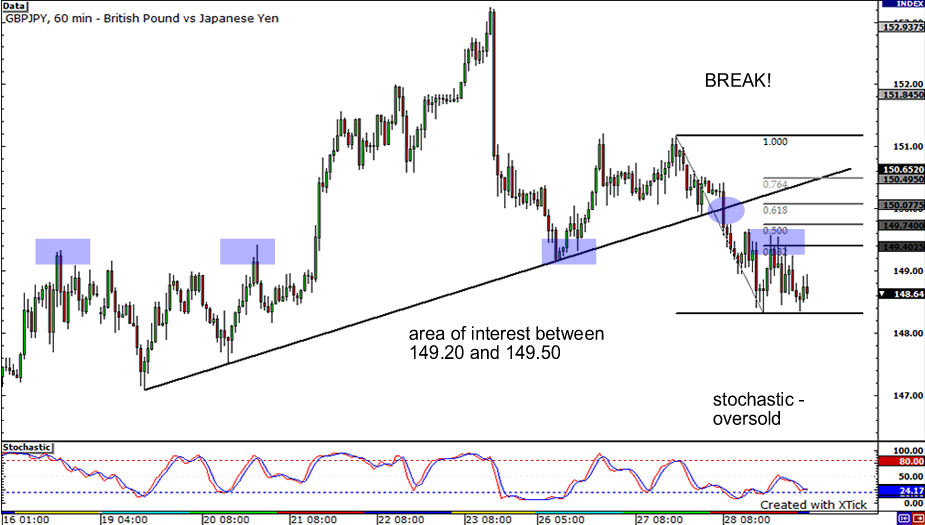
Break it down! Early yesterday, the GBPJPY pair broke through a rising trendline and zoomed all the way down to 148.50. Now, the pair’s down move has slowed down and is consolidating a bit. Stochastics is indicating that the pair is oversold, so sellers may be done. If so, we could see a retracement back up to the .382 Fibonacci retracement level. Notice how price has bounced around the 149.20 and 149.50 price levels. If selling pressure continues though, we may see price test former lows at 147.00.
EURUSD: 4-hour

Lastly, let’s end with the grand daddy of all currency pairs, the EURUSD. Looking at the 4-hour chart, we can see that sellers have managed to break the rising trendline and horizontal support, taking the pair on a steep trip down south. Has the EURUSD topped out at 1.5000 this year? Is this the beginning of a new trend downwards? I dont know for certain but watch out for upcoming support levels at 1.4650 and 1.4500, especially since stochastics indicates that the pair is in deeply oversold territory.


