


USDCAD: 1-Hour
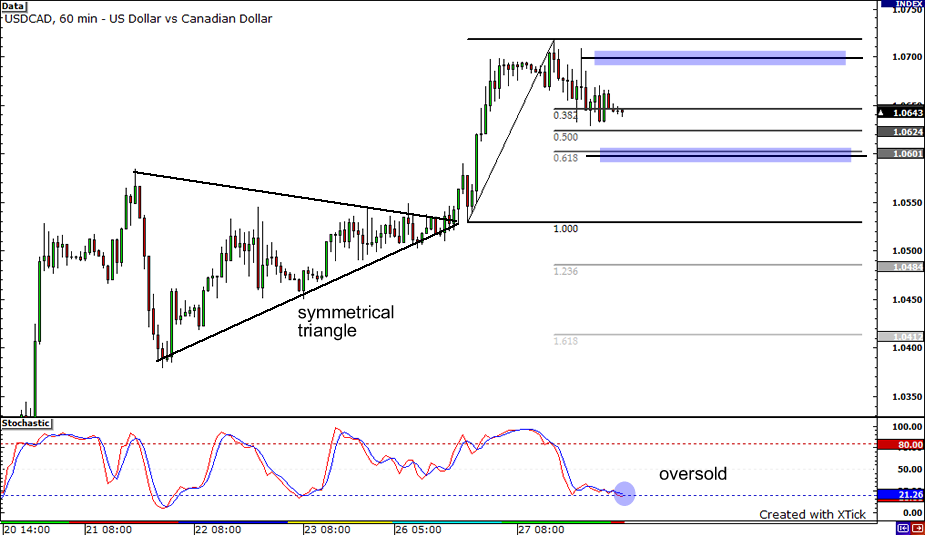
Here’s an update of the USDCAD 1-hour chart I showed you the other day. The pair broke above the top of the symmetrical triangle formation and zoomed all the way up to the 1.0700 area. At first, it seemed to have difficulty making it past the 1.0700 mark but it went on to reach a high of 1.0718 before dropping back down. It is presently lingering around the 38.2% Fibonacci retracement level, from which it could bounce from. The stochastics are in the oversold area, indicating that the pair could climb up anytime soon. However, if it decides to dip a little lower, it could find support at the 1.0600 mark, which is closely in line with the 61.8% Fibonacci level.
USDCHF: 4-Hour

Did you see that tiny inverse head and shoulders formation at the bottom of the downtrend on the USDCHF 4-hour chart? It served as a pretty good reversal signal seeing that the pair sprinted all the way up to 1.0250 after breaking the neckline. Notice that the pair seems to be forming another set of inverse head and shoulders -a larger one this time. With the stochastic ready to move out of the overbought area, the pair could head lower. The pair could dip until the 61.8% Fibonacci level, which is almost in line with the first shoulder. If the downward momentum is much stronger, it could slide all the way down and find support at the broken neckline around the psychologically significant 1.0100 mark.
NZDUSD: 4-Hour

Let’s now move on to the NZDUSD on the 4-hour chart. The bias remains to be on the upside since the pair’s uptrend is still intact. 0.7500 could be its next target if it continues to move up. Presently, the pair is moving down but the uptrend line is just around the corner and could act as a support. If this line breaks, the pair could fall down to the 0.7258 support.


