


EURUSD: 4-Hour
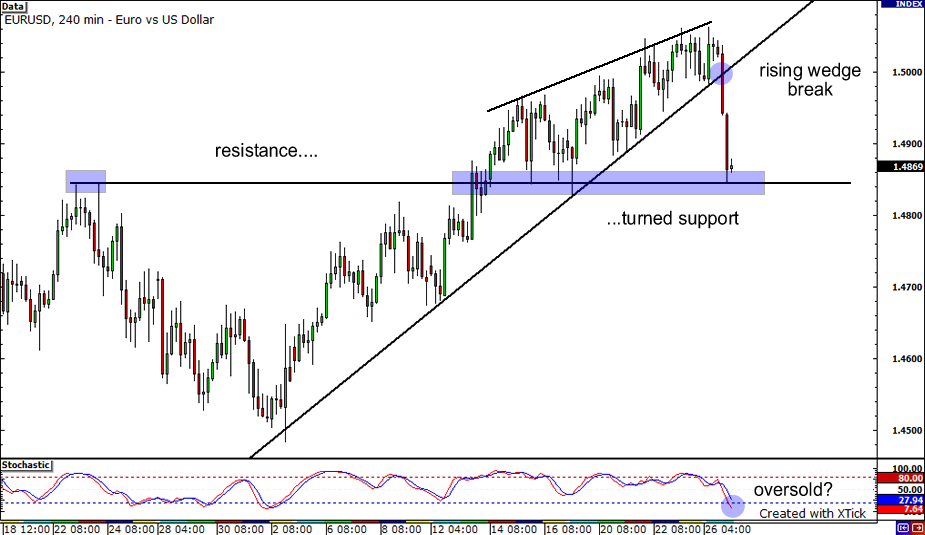
Sellers finally managed to take some control back yesterday as they broke through the rising wedge chart formation found in the 4-hour chart. However, it looks like victory will be short-lived as they currently face 1.4844, a major resistance turned support level. With stochastics at oversold territory, we could see buyers start fighting back. The trend is still upwards and buying support on the dips has been strong. If support holds, we could see buyers take the pair back to the 1.5000 price region. On the flip side, if selling pressures remain strong, the pair could head all the way to 1.4500, this month’s lowest level.
GBPJPY: 1-Hour

After the pair’s dive last Friday, the GBP/JPY pair finally found its bottom at 149.20. Notice how this price level served as a major support level last week. Still, it seems that the GBP/JPY bears aren’t finished yet as the pair fell once again after touching the 50% Fibonacci retracement level at 151.21. Is this the start of a new trend downwards? Are bears “selling the rallies”? If this were the case, the next obvious move for the pair would be a retest of support at 149.20. On the other hand, if the pair starts climbing again, the 61.8% Fibonacci retracement level could prove as resistance.
USDCHF: 4-hour
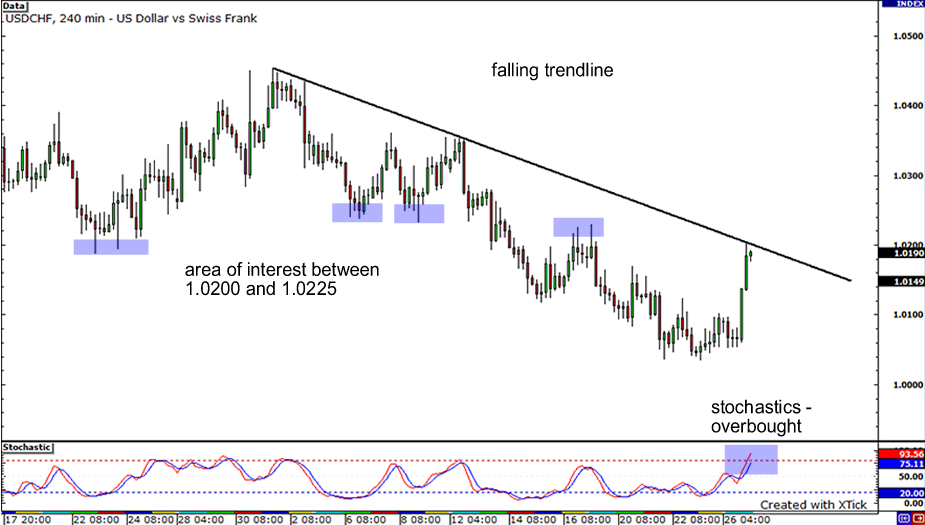
Now, let’s end by taking a look at the 4-hour chart of the USDCHF pair. The pair is currently approaching a longer term falling trendline. In addition, the pair is now trading near an area of interest between 1.0200 and 1.0225. A look back shows that this price area has served as prior support and resistance. Stochastics is also showing overbought conditions – is it time for sellers to show their might? If so, we could see sellers bring down price and test former lows at 1.0050 and possibly aim for the 1.000 handle. If on the other hand, buyers decide that they aren’t through just yet, they push price to former highs around 1.0350.


