


USDCHF: 4-hour

Let’s start of with a look at the USDCHF 4-hour chart. The pair has just bounced down from the 38.2% Fibonacci retracement level and seems poised to resume its downtrend. It could head all the way down and find support at the previous low of 1.0117, which is just a few pips away from the psychological 1.0100 mark. On the other hand, the pair could retrace a little higher, probably until the 50% Fibonacci level, which is in line with previous support at 1.0240. If it breaks above this level, it might go all the way up and hit resistance at the psychological 1.0300 handle or drop down upon reaching the previous resistance level at 1.0350.
GBPJPY: Daily
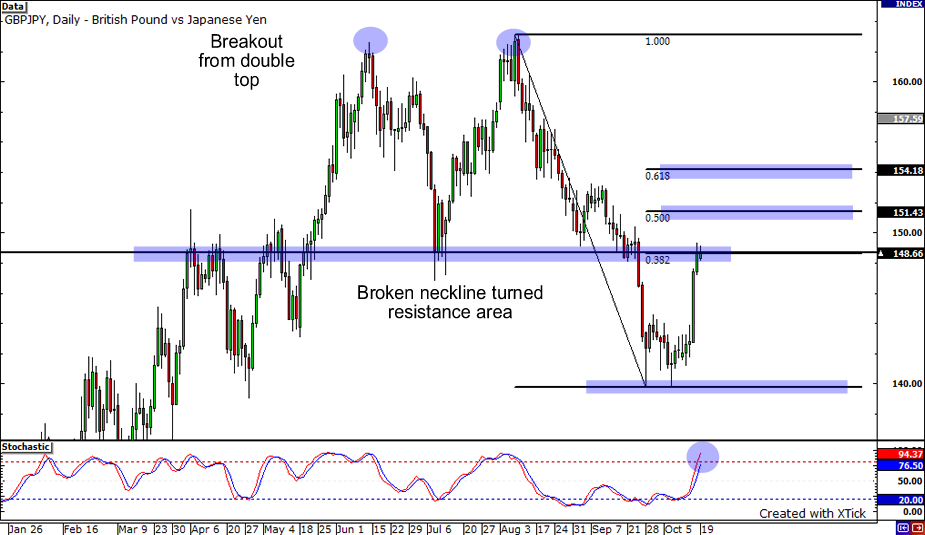
The GBPJPY managed to stage a stellar rally last week after finding support at 140.00. The pair is at an area of interest right now, as it is currently trading around the broken neckline from a few weeks back. Remember, whenever price passes through support, that price area could turn into resistance. Additionally, stochastics is also at overbought territory. If the pair heads downwards again, support at 140.00 could be retested. On the other hand, if sellers are unable to keep buyers at bay and price actions break 150.00, the pair could head towards the 50% Fibonacci (151.43) and 61.8% Fibonacci (154.18) levels.
GBPUSD: 4-hour

Lastly, let’s end with an update on Cable. The pound was on a tear last week as it rallied strongly against the greenback. After it marked its 4-month low at 1.5708 last October 13, it broke out from a complex double bottom formation before finding resistance at 1.6400. With stochastic showing overbought conditions, we may see price fall a bit. If the pair breaks the uptrend support, it may fall back to psychological support at 1.6300. On the other hand, if buyers continue to push the pair higher, the pair may test the previous high at 1.6469 or the 1.6500 price level.


