


USDCHF: 1-Hour

Here’s an update from yesterday’s USDCHF 1-hour chart… The pair just broke below support at 1.0240, tumbled all the way down, and reached a low of 1.0130. That’s a ton of selling pressure! But, right now, it seems that the sellers are already exhausted as the stochastic tries to climb out of the oversold area. The pair could retrace all the way up to the 50% Fibonacci level, which coincides with the previous support at 1.0240. This broken support level could have switched gears and turned into a resistance level now. But if the sellers still haven’t had their fill and want to take the USDCHF even lower, the pair could find psychological support at 1.0100.
USDJPY: 4-Hour

Price action has been choppy as of late but it looks like the USD/JPY pair has managed to keep major support and resistance levels intact. Notice how price bounced off broken support turned resistance at 90.40 twice. Currently, it seems that sellers are trying to take the pair back to support at 88.00, the previous month’s lowest point. However, given how choppy trading is, watch out for a potential break of the falling trend line. If this happens, the pair could retest 90.40 for the third time.
EURJPY: 4-Hour
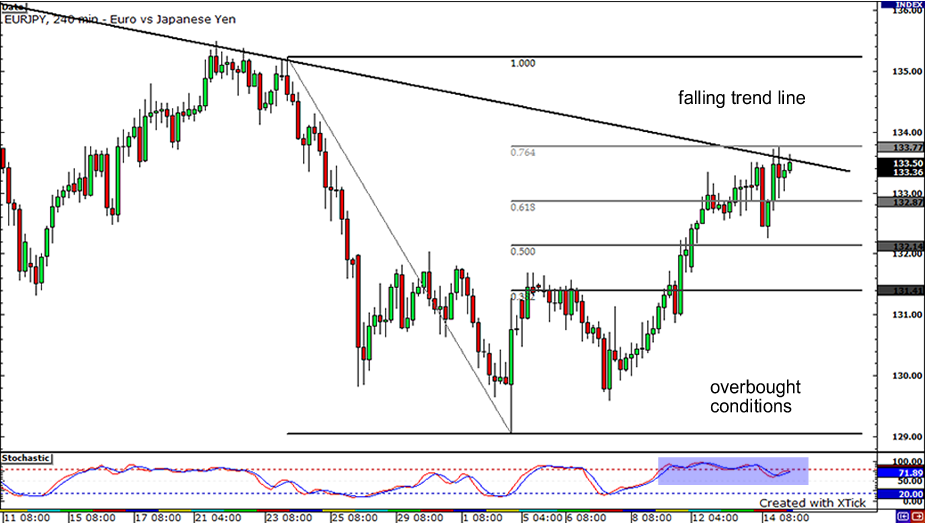
Here’s another look at the EURJPY. After touching the 133.50 early yesterday, we saw some roller coaster movement as the pair shot down to as low as 132.30, before coming back up and testing as high as 133.80. There seems to be a lot of hesitance to bring the pair further as it encounters resistance at the 76.4% Fibonacci retracement level, as well as from the falling trend line. With stochastics showing overbought conditions, buying power may be weak. If so, sellers could bring price back down to test minor support around 132.50, and possibly as low as 131.50. If on the other hand, buyers decide that they aren’t just done yet, look for them to try and break past resistance, and aim for previous highs around 135.00.


