


USDCAD: Daily
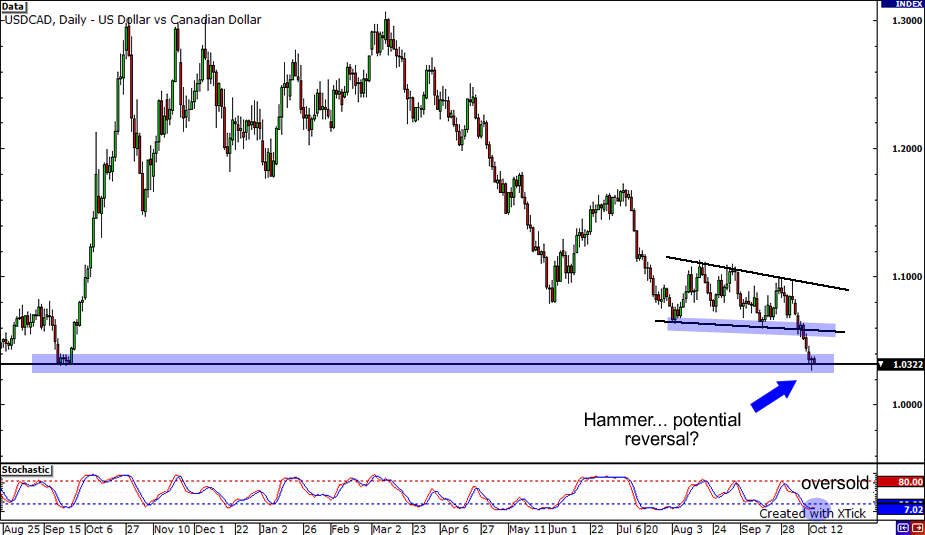
The USDCAD made another yearly low yesterday after breakdown from its range. However, it seems that the pair is showing some signs of reversal. Firstly, it has hit a major support level all the way from September 2008 at 1.0300. Secondly, stochastics shows that the pair might be oversold. Lastly, a bullish hammer has formed because of yesterday’s price action. Have sellers run out of breath? Maybe… but even if that’s the case, going against a momentum as strong as this is always dangerous. If support at 1.0300 breaks, the pair could further drop to 1.0000, a very significant psychological number. Conversely, if the pair retraces some of its losses, it could retest broken support at 1.0500.
AUDUSD: 4-hour
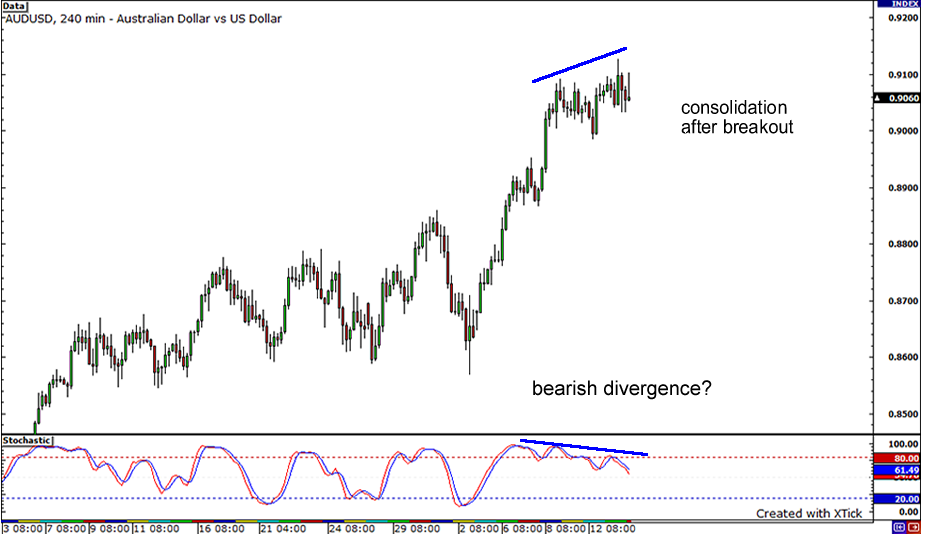
And now, let’s move on to the Amazing Aussie! After breaking out a week ago, the pair has been making new yearly highs. The gains however, have not been too convincing, as the pair is now somewhat in consolidation. Could another breakout be in the cards? The pair is currently showing some signs of bearish divergence, as price action has been showing higher highs, while stochastics have been registering lower highs. If sellers start to take over, look for them to bring price down and to encounter some support at 0.9000 and 0.8950. If on the other hand, buyers continue to dominate the pair, they could possibly push the pair to new highs, perhaps at 0.9200.
EURJPY: 4-hour
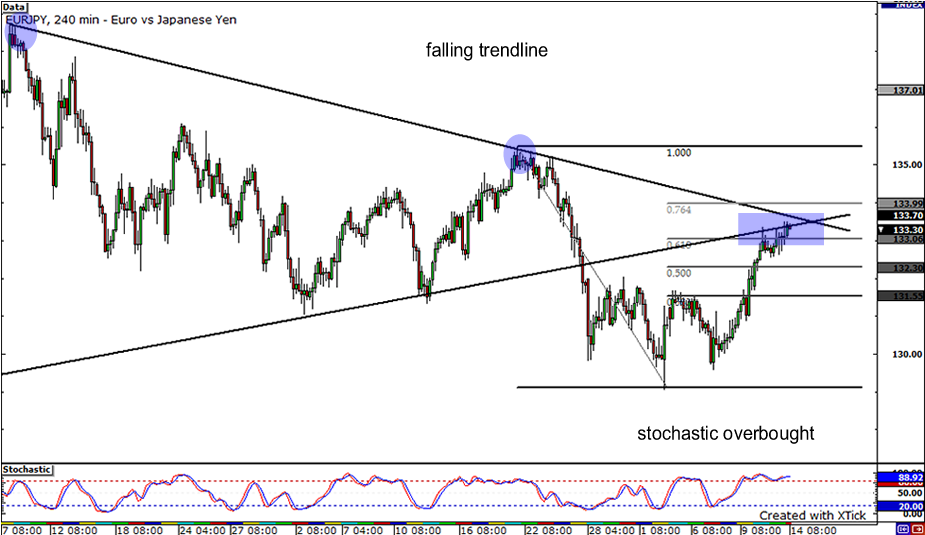
Lastly, let’s end with a cross – the EURJPY! The pair has been on a strong rise ever since testing the 130.00 price handle. We could however, be in line for a reversal as the pair is now approaching a falling trend line at 133.50. In addition, this price area intersects with a former support line that could now prove to be resistance. With price hovering between the .618 and .764 Fibonacci retracement levels and stochastic showing overbought conditions, could buyers have run out of room to push the pair higher? If so, perhaps we will see the pair reverse and find support at 131.50, with further support at 130.00. If however, sellers dont take control, buyers may push the pair past resistance and we could see the pair test former highs just above 135.00.


