


USDCHF: 1-hour
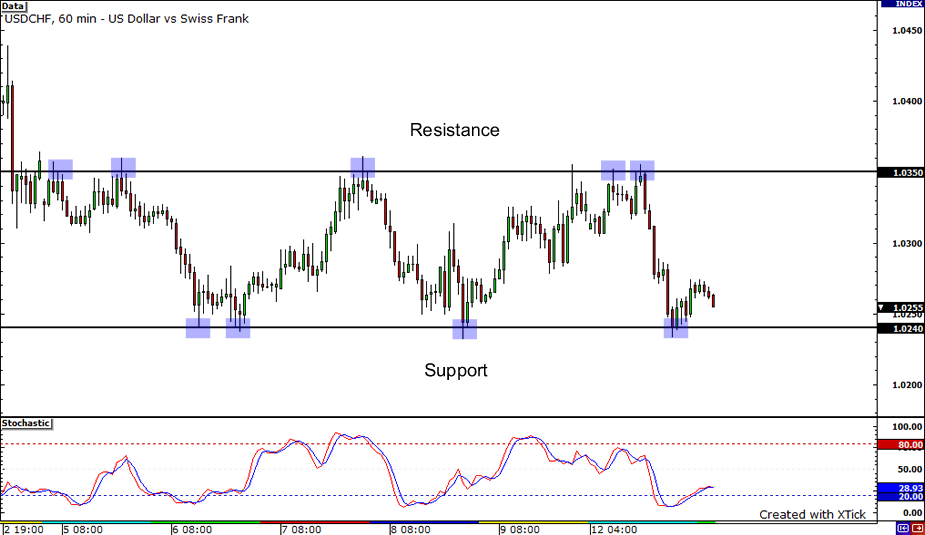
Let’s start off with the USDCHF 1-hour chart… This pair is now safely confined within a range, with support at 1.0240 and resistance at 1.0350. It has been bouncing up and down within this range since the end of last week and has just bounced off the support level yesterday. I was thinking that it would go all the way up until the resistance level or probably just until the psychological resistance at 1.0300 but it seems like the upward price action was cut short. The pair looks ready to retest the support level again… Would it break out this time? If it does, it could find psychological support at 1.0200.
GBPJPY: 1-hour
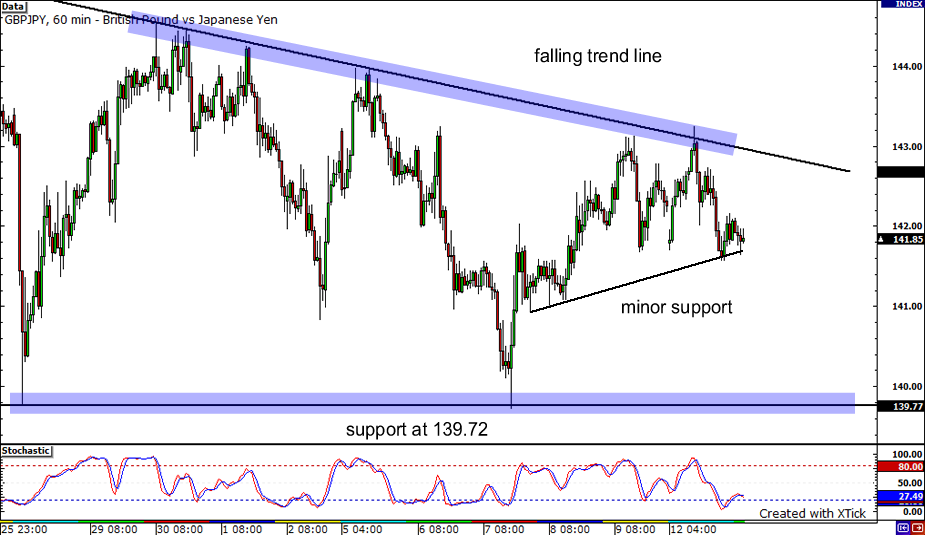
Next, let’s head on over to the GBPJPY. The GBP/JPY took another nose dive yesterday after hitting the falling trend line around the 143.00 area. Currently, sellers are showing some sign of exhaustion as the pair has been consolidating just a few pips above minor support. I’d watch carefully as a break in this area could cause sellers to jump back in the overall downward trend, exacerbating the pair’s losses from yesterday. If this happens, the next major support levels to note are 141.00 and 139.72. However, if price bounces from the minor support, we could see another retest of the falling trend line.
NZDUSD: 1-hour
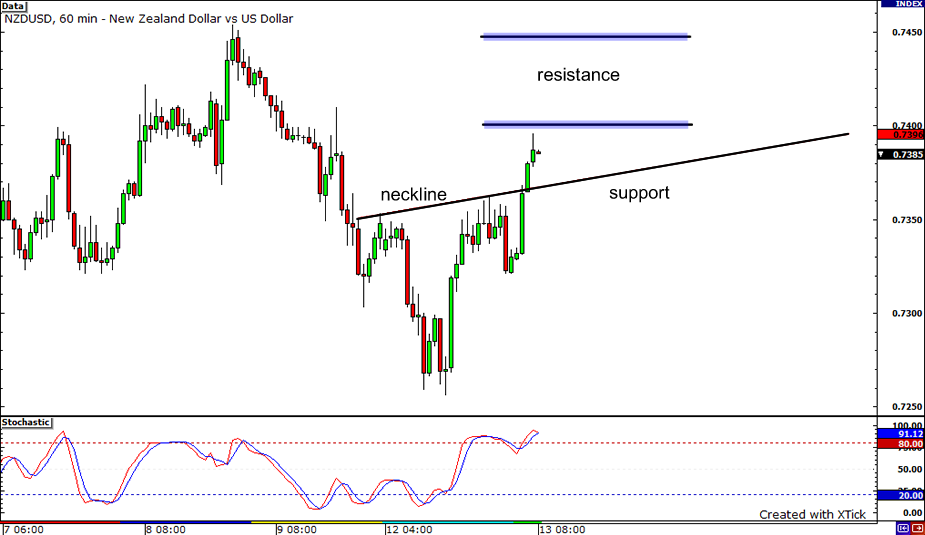
Lastly, let’s finish off with an update on the NZDUSD pair. As can be seen from the chart, the pair recently broke out from an inverse head and shoulders formation. The next notable resistance that can block its upward move is the 0.7400 marker. If price action breaks through this handle, it could possibly reach 0.7450. However, if the pair fails to do so, it can fall back to support at the neckline.


