


GBPUSD: Daily

Let’s start the week with my analysis on the GBPUSD daily chart. The pair broke down from a head and shoulders formation during the last week of September. Given this, the pair has a downside bias with a target price of 1.5000, which computed from projecting the height of the formation from the point of breakout. However, there seems to be some signs of a pullback happening. If this happens, the pair could revisit the formation’s neckline at 1.6200.
USDJPY: 4-Hour
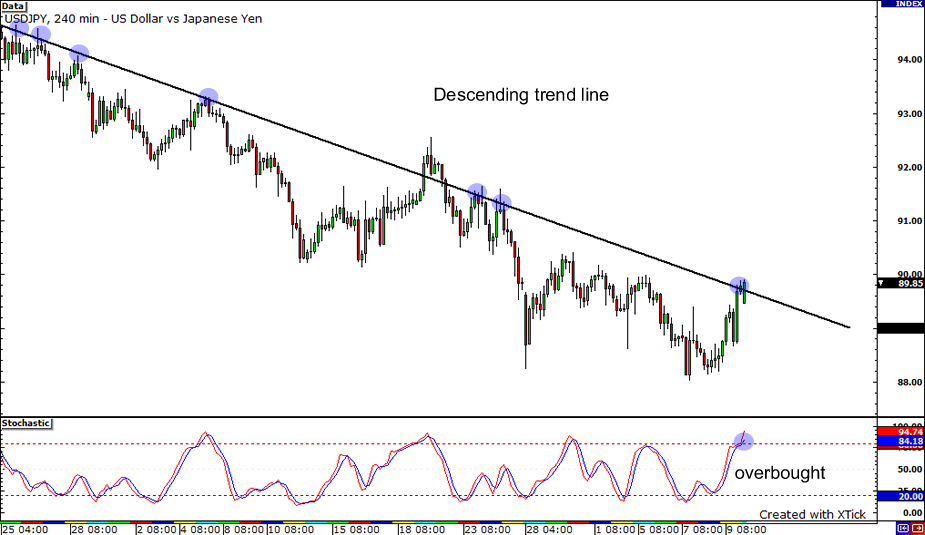
It looks like that descending trend line on the USDJPY 4-hour chart has been holding up quite strong! In fact, this trend line has held since mid-August this year with just a couple of false breaks in between. Right now, the price is sitting right on the trend line as though deciding whether to break out or not. The psychological 90.00 handle intersects with the trend line and could serve as a good resistance level. If the pair indeed tumbles down, it could then find psychological support at 89.00 or at the previous low of 88.65. But if it’s able to make a real break from the trend line this time, this pair could be headed all the way up! Still, possible resistance levels are located at the psychological 91.00 and 92.00 levels or the previous month high of 92.55.
EURJPY: Daily
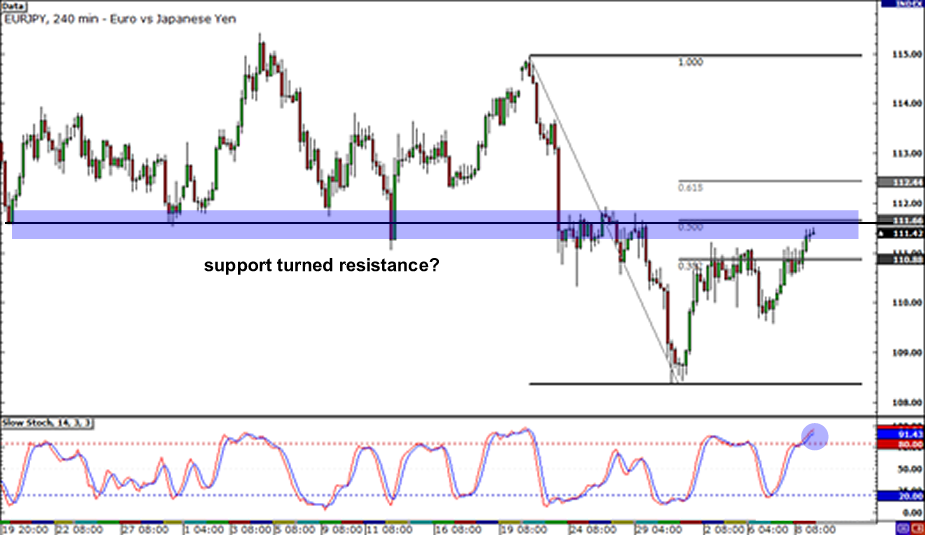
Finally, let’s end with my favorite currency cross, the EURJPY! Taking a look at the daily chart, we can see a lot of different things starting to brew. After forming a triple top, the pair was able to break past support at the neckline. Right now however, the pair testing the former neckline once again. With price action sitting at the psychologically significant 132.00 price mark, could we see the former neckline hold as resistance? If it holds, we could see price test former lows at 130.00 and 129.00. Take note however, that we are seeing some bullish divergence on the pair as well. With price showing a bullish green candle to end last week, we could see more buying to come. If buyers do come out of their slumber, look for them to push price back to as high as 134.00, where they could encounter some downward resistance.


