


AUDUSD: Daily
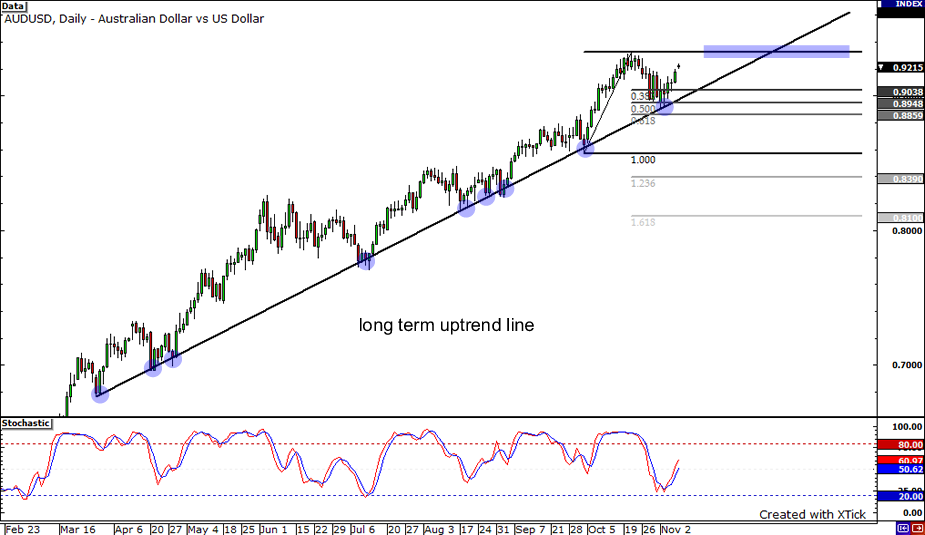
That long-term uptrend line on the AUDUSD daily chart has been holding up really well! This rising trend line, which was formed starting mid-March this year, has been tested by the pair a lot of times but hasn’t been broken to date. The pair just bounced from the 50% Fibonacci retracement level, which intersected the trend line, a few days ago. The stochastics are climbing, which suggests that the pair could continue to rise as well. It could encounter resistance at the previous high of 0.9328, which is the pair’s latest yearly high. If the upward momentum loses steam, the pair could retest the trend line once again.
USDJPY: Daily
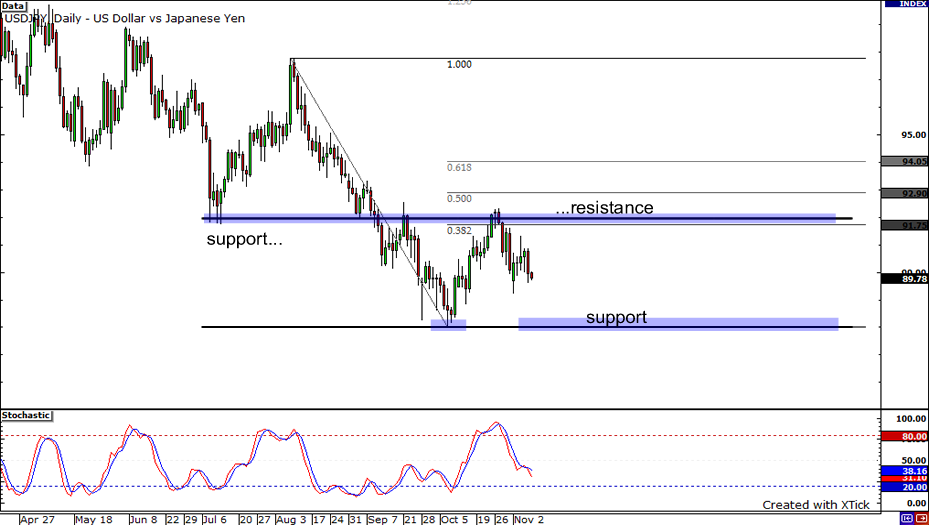
Next is the USDJPY pair, again, on its daily chart. As you can see from above, the pair recently rallied back to the 92.00 mark. Incidentally, this price level falls in line with a previous support and the 38.2% Fibonacci retracement level of the most recent motive wave. The pair is presently moving down after hitting the said resistance. Given this, it could fall down to the October low which is just a pip higher than the psychological 88.00 support. Though, the pair could revisit the 92.00 mark again if the dollar strengthens for some reason.
USDCHF: 1-hour
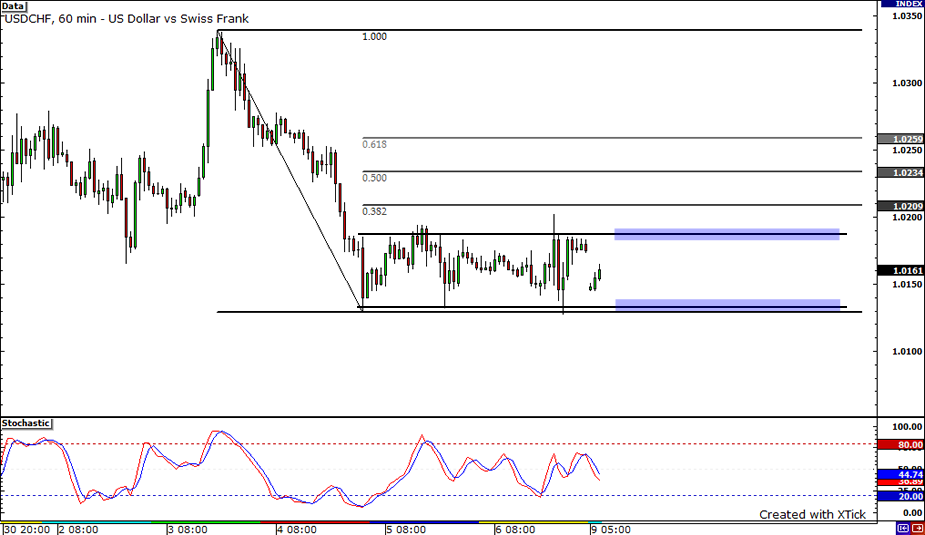
Lastly, let’s check out how the USDCHF pair is doing. Looking at the 1-hour chart, I noticed that the pair was stuck in a tight range for the past couple of days. It has been bouncing up and down from support at 1.0132 and resistance at 1.0185. Would the pair stay confined within this range for today or would we see a breakout? If it breaks above 1.0185, it could have difficulty moving past the 1.0260 area, which served as previous resistance for the pair. Coincidentally, this is also the 61.8% Fibonacci retracement level. If it breaks below support at 1.0132, it could bounce upon hitting the psychologically significant 1.0100 handle.


