


EURUSD: 1-hour

Let’s start with my analysis on the EURUSD. As you can see from its 1-hour chart above, the pair appeared to have risen from the dead when it surged above the 1.4850 resistance. It, however, hit a wall at the 1.4900 handle after breaking out. Presently, the pair is trading between 1.4900 and 1.4850.It can range for awhile given that its stochastics are already in the overbought level. The EURUSD, or the fiber as some traders call it, can fall down to 1.4800, which coincides with its 38.2% Fibonacci retracement level, if the 1.4850 support gives way. Though, this support seems to be sturdy enough for it to spring the fiber back to 1.4900.
USDCAD: 4-hour
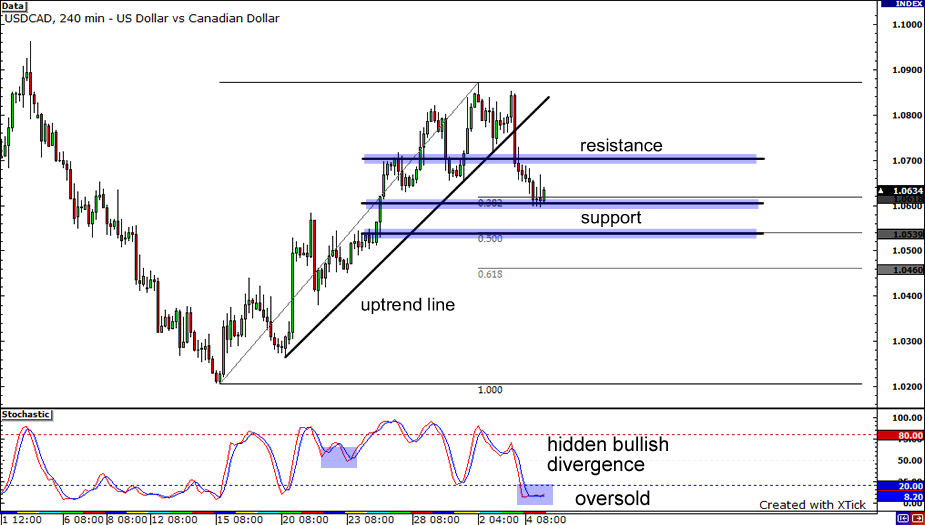
Next is the USDCAD on the 4-hour time frame. The pair recently broke its uptrend line. The 1.0600 mark, which falls in line with its 38.2% Fibonacci retracement level, appears to be keeping it afloat in the mean time. Should this support break, the pair could find itself down to the 50% Fib. The presence of a hidden bullish divergence with the stochastics in the oversold region, however, suggests that buyers could jump in anytime soon which could lift the pair at least to the 1.0700 hurdle.
USDJPY: 1-hour
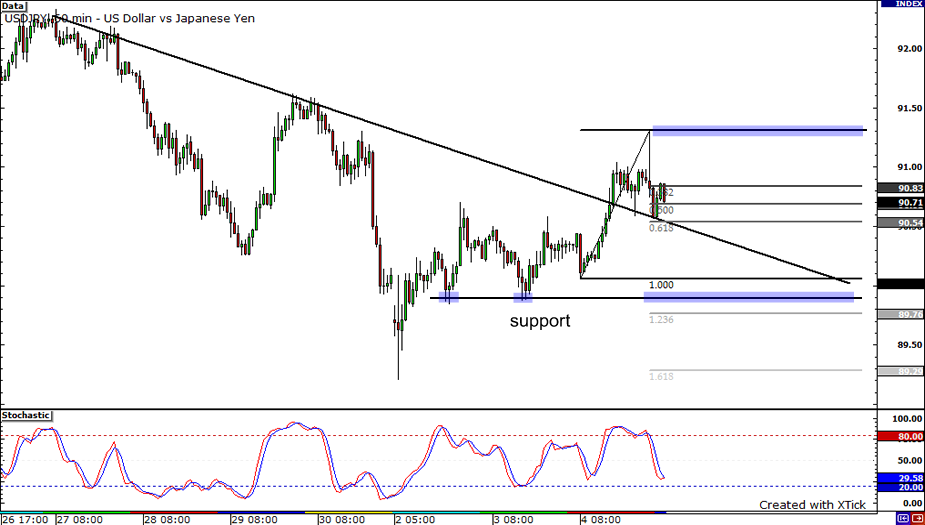
Here’s the lowdown on the USDJPY pair… Connecting the highs of the pair would give you a neat descending trend line on the 1-hour chart. The pair has had a few failed attempts to break above that trend line but, just yesterday, it succeeded. It was able to surge to a high of 91.31 before retracing to the 61.8% Fibonacci level, bouncing off the top of the trend line. Although the stochastic hasn’t fully reached the oversold area, it seems poised to move upwards, which indicates that buyers are about to take control. Buyers could take the pair all the way up and encounter resistance at the previous high of 91.31. But if sellers take the upper hand, they could take the pair back below the trend line until support at 89.90.


