


EURJPY: 1-Hour
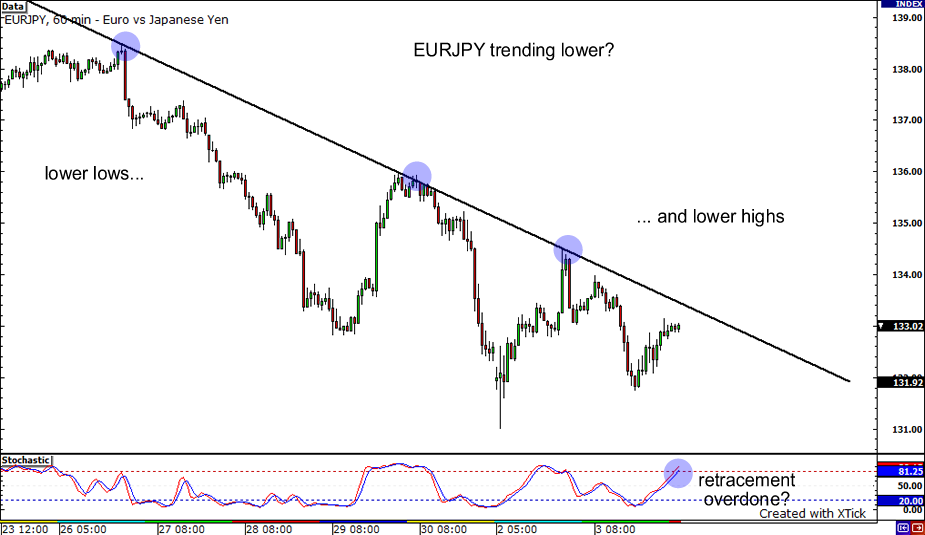
Ouch. After hitting the falling trend line, the EURJPY took another trip south, confirming the overall downtrend. Sellers are in complete control of the pair as indicated by the lower lows and lowers highs. If seller strength keeps up, we might see some significant resistance around the 133.50 since this price level coincides with the falling trend line and stochastics is in overbought territory. If the pair does bounce, the next support levels to watch out for are 131.75 (yesterday’s low) and 131.00 (this week’s low).
GBPJPY: 1-Hour
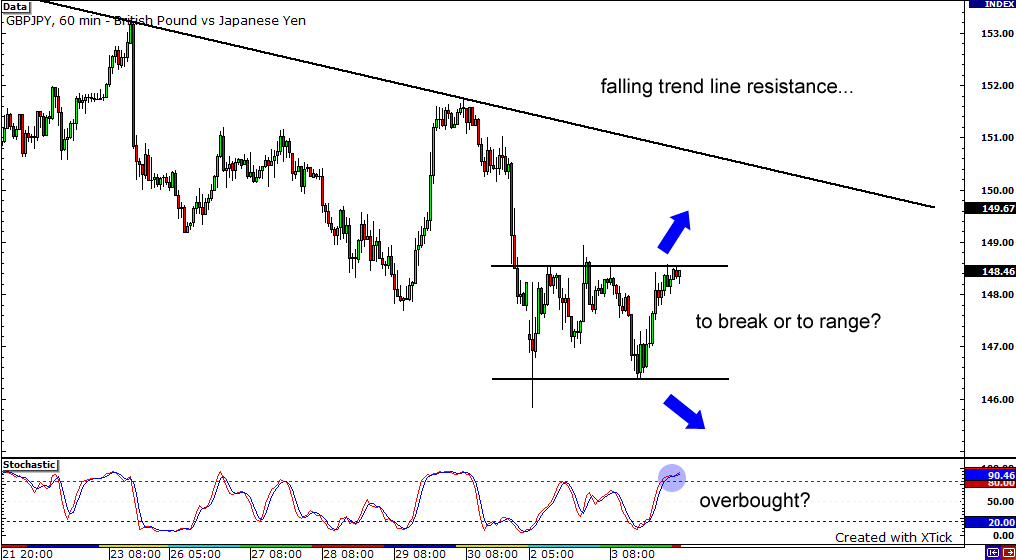
Up next, I have a 1-hour chart of the GBPJPY pair for you. The pair has been ranging as of late, bouncing between 148.50 and 146.50. Right now, the stochastics is indicating that the pair is overbought. With the pair sitting at resistance, we could see sellers finally reassert themselves and bring price back down to support at 146.50. If on the other hand, buyers continue to place their long orders, we could see price action ram through resistance and meet the falling trend line at 150.00.
AUDUSD: Daily
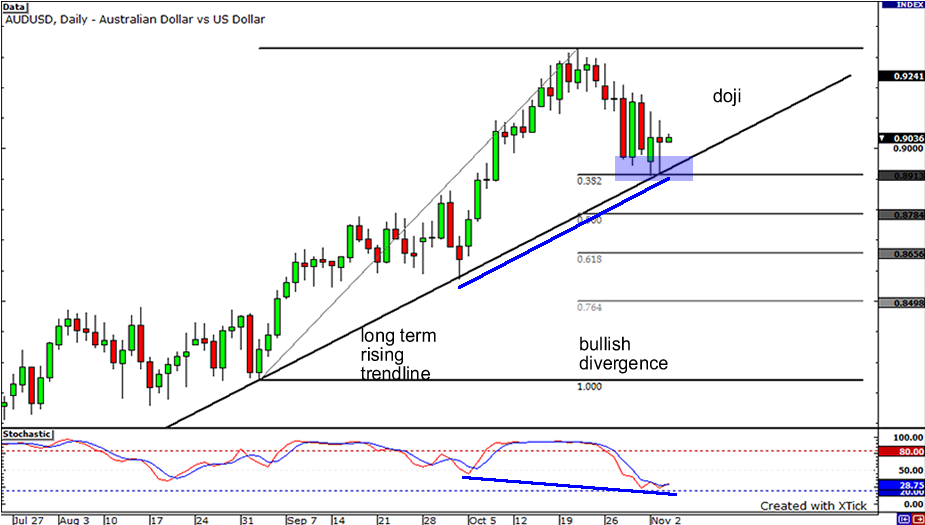
Lastly, let’s take a look at the daily chart of AUDUSD. After topping out just above 0.9300, the pair has retraced and touched 38.2% Fibonacci retracement level, which just happens to coincide with a long term rising trend line. With a doji forming after yesterday’s action and the pair showing bullish divergence, could we see the pair rise up once again and test the yearly high at 0.9328? Or will sellers dominate the market and finally break through the uptrend line and test support at 0.8550?


