USDJPY: 4-hour
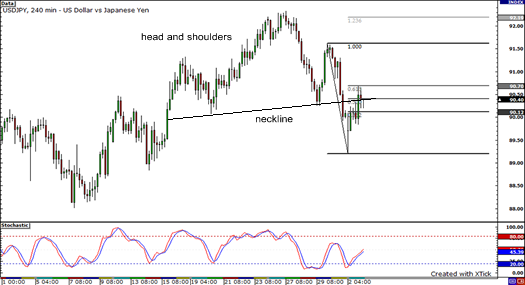
Let’s find out first how things are going in the USDJPY 4-hour chart. The USDJPY pair may have been on an uptrend for a while but that head and shoulders formation hints that a reversal is due. The pair just broke below the neckline last week, signaling that a downtrend could now be in the works.
Just yesterday, the pair retraced up to the 50% Fibonacci level, which closely coincides with the neckline of the head and shoulders. The pair might keep moving down until it finds support at the previous low of 89.20.
However, the stochastics still seem to be heading higher, which means that the price could move up as well. If the 61.8% Fibonacci retracement level does not serve as resistance for the pair, it could keep climbing until it hits the previous high of 91.60.
USDCAD: 4-hour
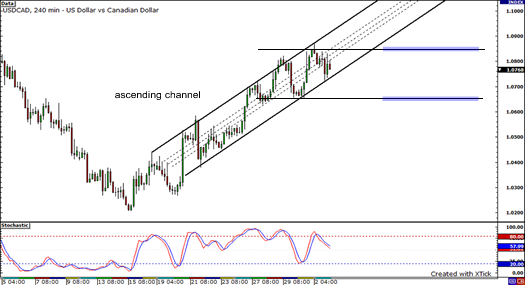
Heading over to the USDCAD pair… The ascending channel on the USDCAD 4-hour chart is holding up really strongly, seeing that the pair has been bouncing up and down inside it for almost two weeks now.
The stochastics seem to be moving down, which means that the pair could keep edging lower. On the way down, the pair could bounce from the bottom of the channel or at previous support around the 1.0655 area.
If the pair continues its ascent, it could encounter resistance at the previous high of 1.0872. It might also have a tough time piercing through the top of the channel, which nearly comes in line with the psychological 1.0900 handle.
NZDUSD: 1-Hour
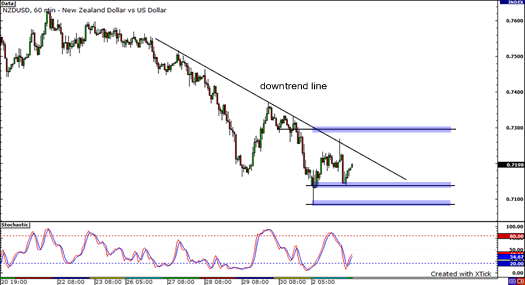
Lastly, we have the NZDUSD pair on its 1-hour chart. As you can see, the pair has been on a downtrend for quite some time now.
Presently, it is approaching the downtrend line after hitting support around 0.7137. A resumption of risk appetite could push the pair above this resistance. It could reach 0.7300 if it does.
On the flip side, the pair could fall down to 0.7100 or even at 0.7084, which is yesterday’s low, if it closes below the 0.7137 support.