


AUDUSD: Daily
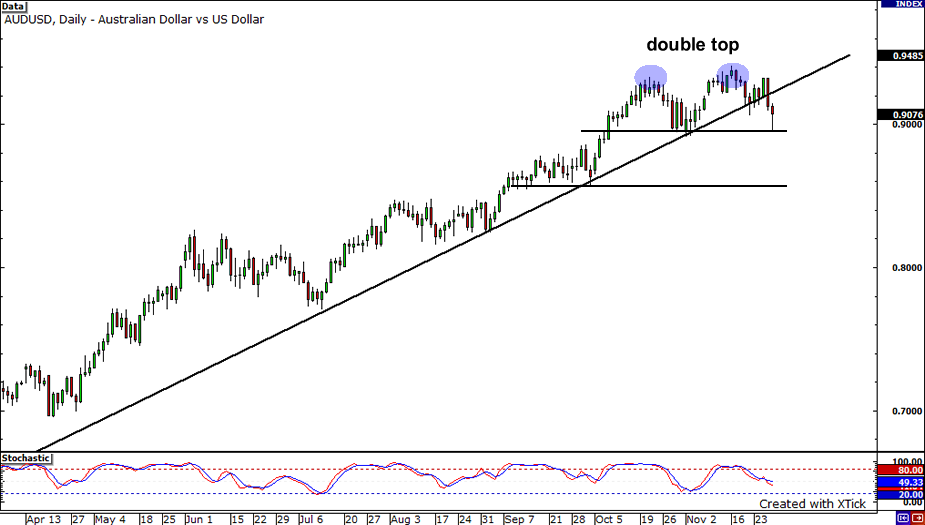
Is that a trend line break I see? Has the AUDUSD finally topped out for the year? Or is just another major correction? Hmm, judging from how bears just pierced through the ascending line, it looks like the pair is going to head lower further. Notice how the bulls managed to push the pair higher when it came near the horizontal neckline around the 0.8900 handle, forming a nice double top. If this price level holds, the pair could go as high as 0.9300 before finding resistance. However, if the opposite happens, look for a move towards 0.8500, the next major support level.
GBPUSD: 4-Hour

Ouch, it looks like the GBPUSD took a major hit last week. The pair, after topping out at 1.6745, staged a massive 450 pip drop before it was able to find support. Now that price managed to recover some of its losses, it looks like sellers are ready to take the pair lower again. Price is currently sitting at 1.6500, a major support-turned-resistance level. It also nicely lines up with the 50.0% Fibonacci retracement level. If sellers do start jumping back in, the pair could find itself at the 1.6300 handle again. On the other hand, if candles start closing above 1.6500, look for a move towards the 61.8% Fib.
EURUSD: 1-Hour
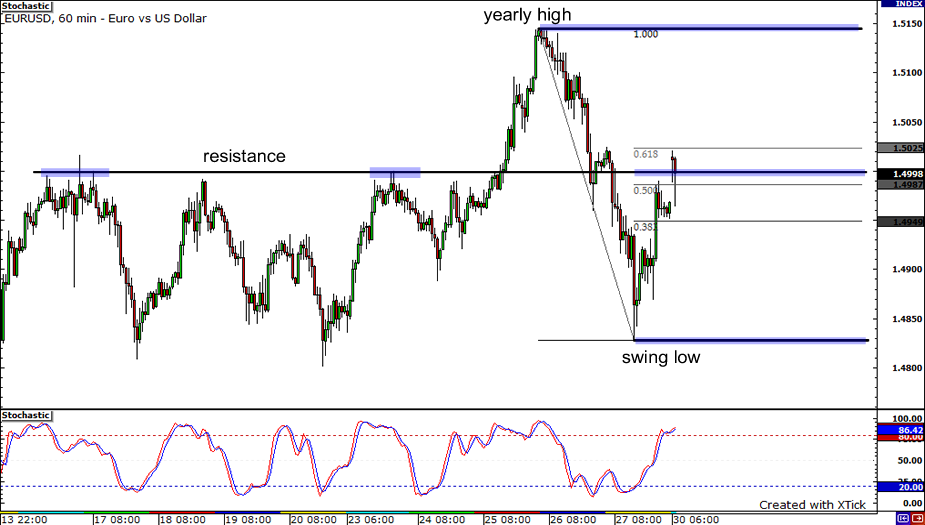
Next is the EURUSD pair on its 1-hour chart. The pair went back to earth and fell to 1.4828 after marking a fresh yearly high at 1.5132. Though as you can see, buying interest surfaced again, causing the pair to rally back to re-test the 1.5000 resistance. Coincidentally, this mark lies just above the 50.0% Fibonacci retracement level that I drew. With stochastics in the overbought area, the chances of the pair sliding back to the swing low that I marked are higher. On the other hand, it can move back up to its yearly high if it is able to break above the 1.5000 level.


