


USDCHF: 1-Hour
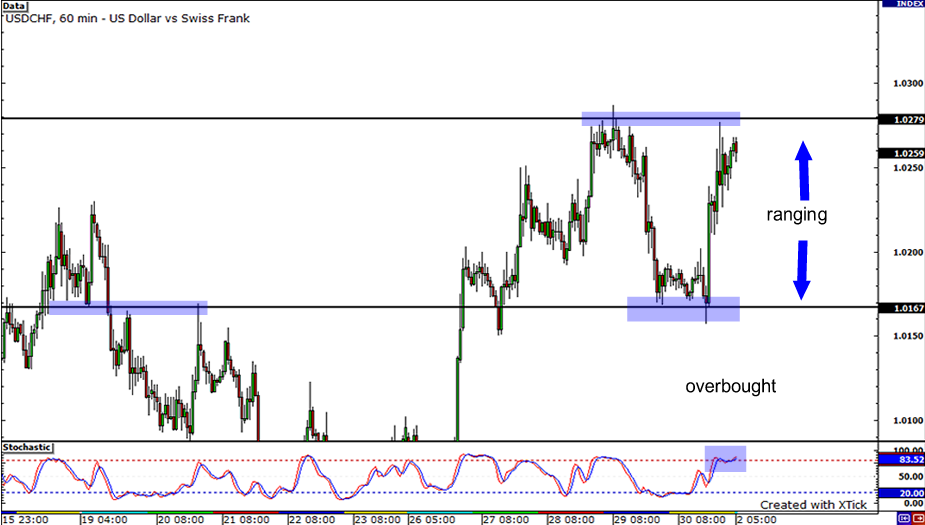
Let’s begin with another look at the USDCHF. After shooting up at the start of last week, the pair experienced some ranging as the days went by. After topping out near 1.0280, the pair fell and tested an area of interest around 1.0160. By the end of the week however, buyers made their move, bring the pair back up to prior resistance. What could be in store this as we begin November? Will we see some ranging and will the pair reverse and test prior support? Or can buyers bring the pair past resistance and break for new highs?
EURUSD: 4-Hour
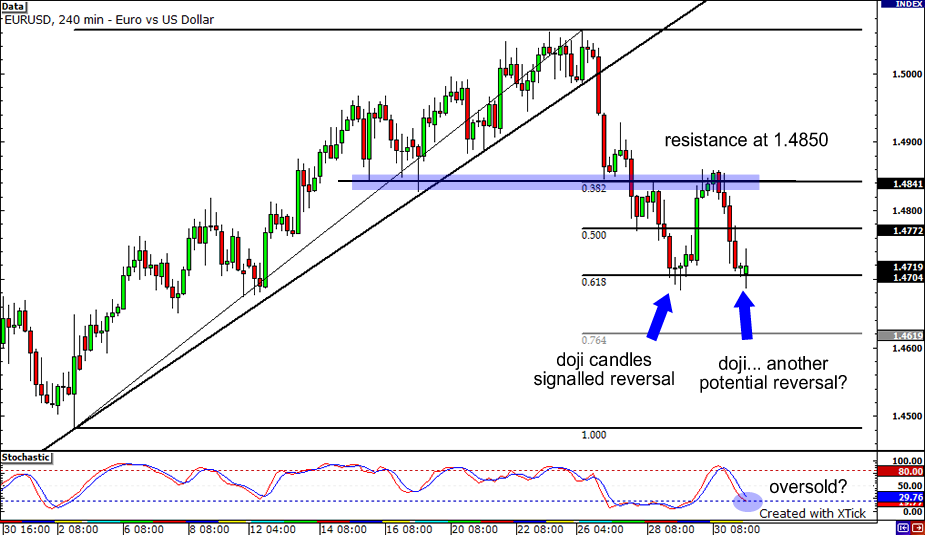
It looks like 1.4700, which nicely coincides with the 61.8% Fibonacci level, is holding strong as another set of doji candles has formed on the 4-hour hour chart. Doji candles are usually early signs of seller exhaustion, and that buyers are starting to jump back in to buy up the pair again. Notice how this held true last week when the pair climbed up after it hit 1.4700, formed a bunch of doji candles and stochastics went into deeply oversold territory. Will history repeat itself, especially since stochastics is indicating that the pair might be oversold again? If it does, watch out for resistance at 1.4850. However, if support breaks, the next major support level in sight is 1.4500.
USDJPY: Daily
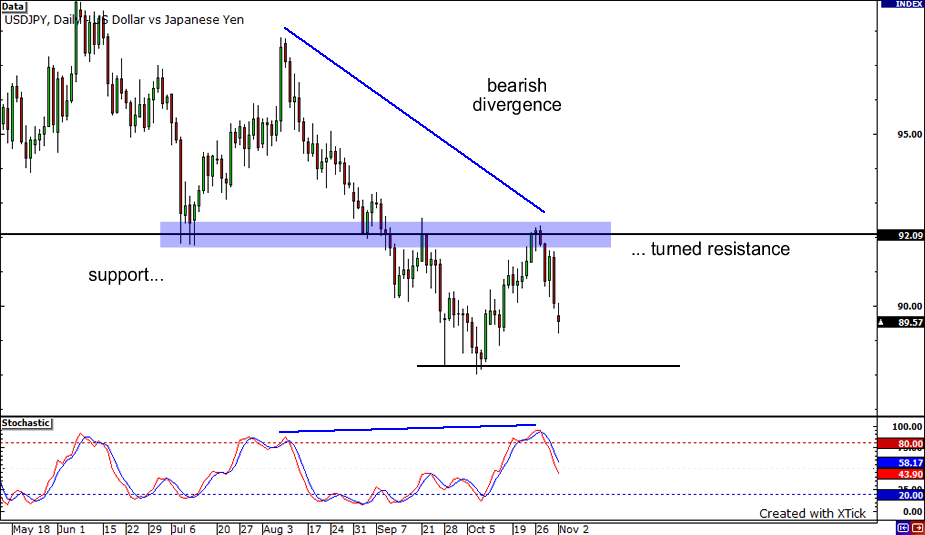
Last week, we saw the USDJPY start climbing up, which seemed to signal that the bears were done with all their selling and that the bulls were starting to take control. However, the victory proved to be short lived. The bears started jumping back in the overall trend after the pair hit 92.00, a support turned resistance level, and formed a major bearish divergence on the daily. It seems that bears are bee lining towards 88.00, the previous month’s lows and this year’s lowest price. Both of these are important technical levels to watch, as a break in any of these levels could determine the pair’s overall general direction.


