


EURUSD: 1-Hour

If you were the range trader type of guy, you’d probably be swimming in cash right now as the EURUSD pair has been bouncing around a 200 pip range since the beginning of the month. Now that the top of the range around 1.5000 has been hit, it seems that price is starting to head to 1.4800 again. Be careful, however, as there seems to be a slight bias on buying. Notice how bulls quickly buy the pair on the dips as opposed to consolidating first before reversing (like at the top of the range). With stochastic almost at oversold territory, bears might be in for a tough battle.
GBPJPY: 4-Hour
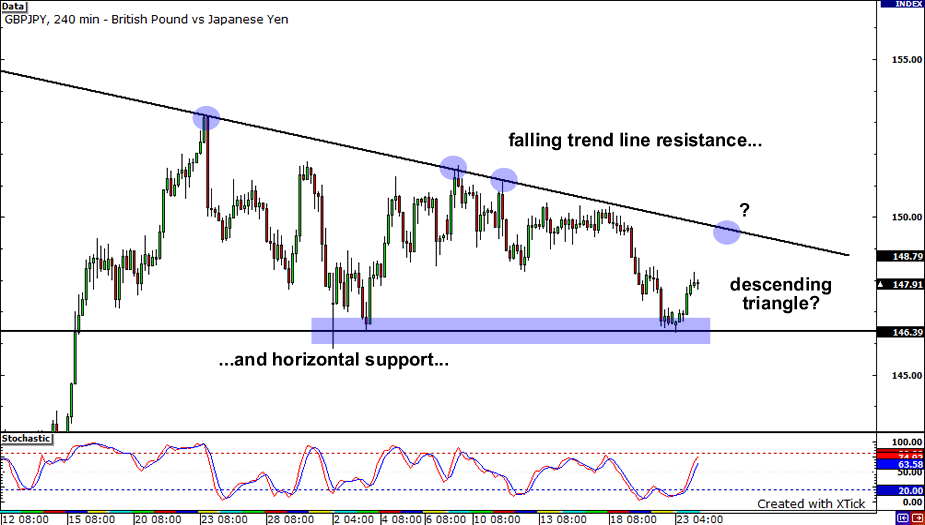
After the GBPJPY’s sharp drop last week, it seems that the pair’s trading range is starting to tighten as it approaches the tip of the huge descending triangle formation on the 4-hour. You can see the chart formation clearly by drawing a horizontal support at the previous week low and a connecting the tops of October and November. Since the pair is forming lower lows, there is a slight bias on selling and we could see a break in support soon. If this happens, the pair’s next stop would probably be around 145.00, a previous area of interest. However, the pair has already bounced from support and the likely move at the moment is for the pair to retrace some of its losses and retest the falling trend line around 149.50.
AUDUSD: 4-Hour

Finally, let’s end the day with a look at the AUDUSD. Last week, I pointed out how a head and shoulders formation had formed on the pair and that price action broke past the neckline. After hitting as low as 0.9061, the pair has retraced and is now testing the former neckline. Will it now serve as resistance? With stochastic showing overbought conditions, we may see buyers thin out and sellers take control. They could bring price back down to test the former low at 0.9061. On the other hand, if buying pressure remains strong, we could see the pair move higher and test former highs near 0.9330.


