


NZDUSD: 1-Hour
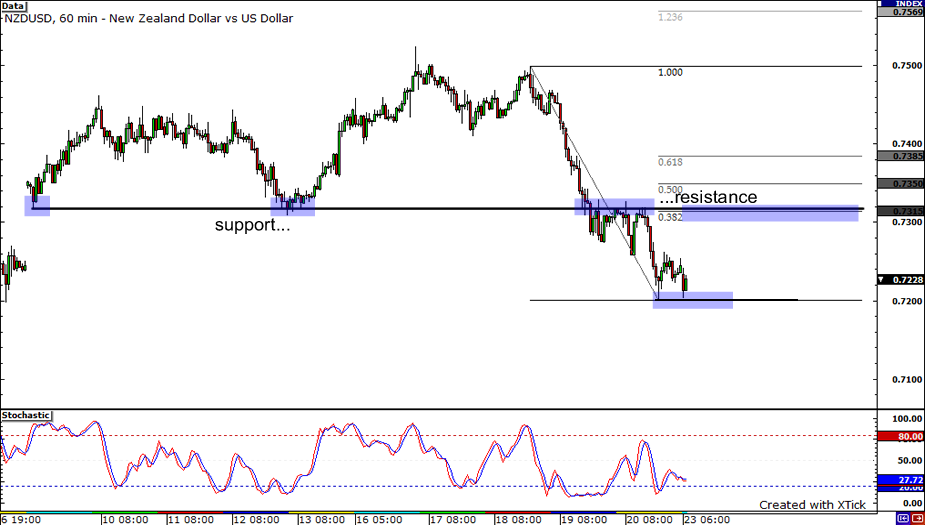
Good morning forex friends! Let’s start the week with my analysis on the NZDUSD pair. As you can see from its 1-hour chart above, the pair went on a downhill and broke below the 0.7315 support. Buyers started to pick it at around 0.7201. In my view, the pair could rebound all the way back to the previous support at 0.7315. Sellers could jump back in to push the price down again since this mark also happens to fall in line with the 38.2% Fibonacci retracement level that I drew.
USDCHF: Daily
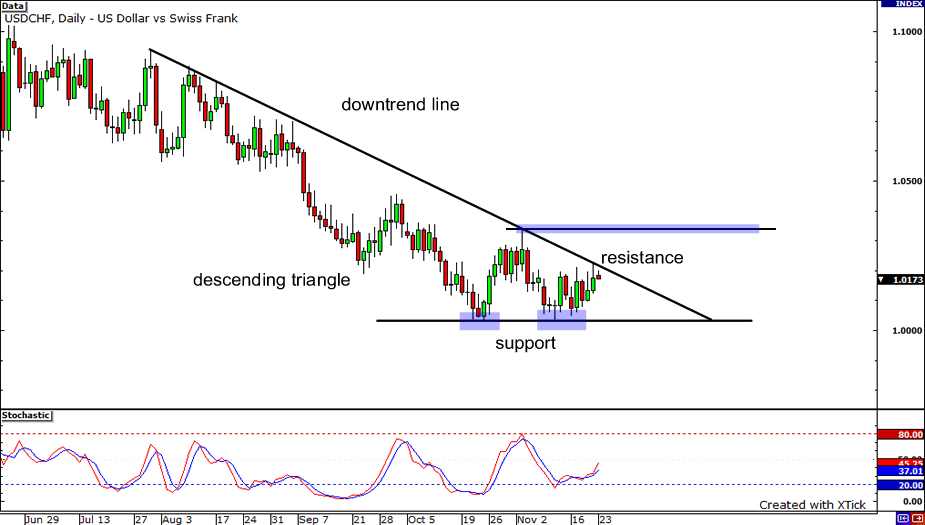
Next is the USDCHF pair. A nice descending triangle pattern can be seen forming in its daily chart. From what I can see, it looks like the pair is poised for another move downwards. The pair could lose another 400 pips (gauged by getting the height of the triangle) if the formation’s support gives way. On the flip side, it could move towards the 1.0340 resistance if it’s able to break the downtrend line.
EURUSD: 4-hour

Moving on to the EURUSD 4-hour chart… Lately, the pair has been drawing lower highs with a descending trend line neatly connecting those tops. It has also found support around 1.4830, thus creating that nice descending triangle. The question is: Would the pair break on the upside or the downside? Although the stochastic oscillator hasn’t reached the oversold area yet, it seems ready to climb up. If the pair breaks above the top of the triangle, it could soar all the way up to the 1.5050 area and retest its yearly high. On the other hand, if it drills through the bottom of the triangle, it could tumble down to this month’s low of 1.4630.


