


GBPJPY: 4-Hour
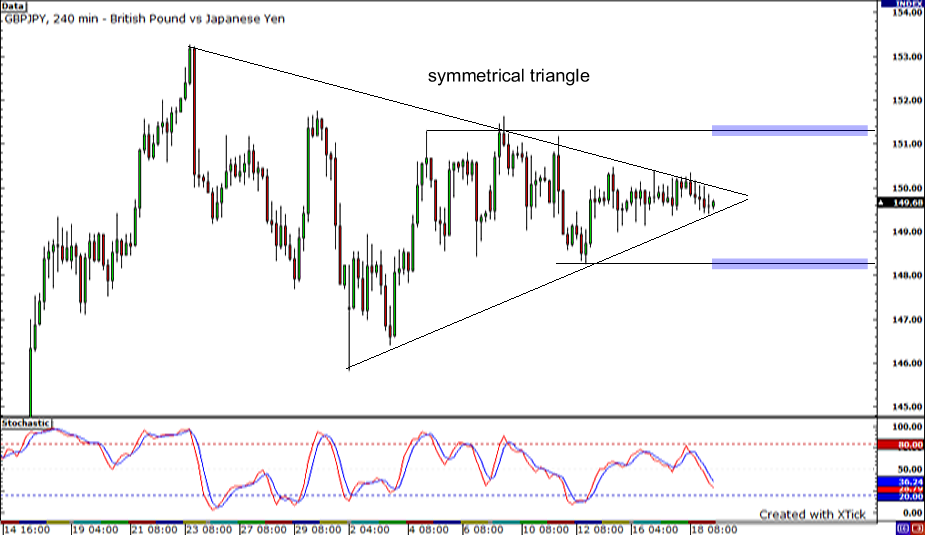
Whoa! That symmetrical triangle on the GBPJPY 4-hour chart is holding up really well! The pair’s consolidation keeps getting tighter and tighter as it gathers enough momentum for a strong breakout in either direction. If the buyers take control, they could push the pair all the way up to the minor resistance around 151.20. If the upward momentum is strong enough to carry the pair past 151.20, it could even race towards the previous month high of 153.25. On the other hand, if sellers take the upper hand, they could take the pair all the way down to the previous week low of 148.30.
EURUSD: 1-Hour

Next is the EURUSD pair on its 1-hour chart. The ‘fiber’ has been bouncing up and down inside a range with support at 1.4015 and resistance around 1.5015. Minor support could also be seen right at the psychologically significant 1.5000 mark, from which the pair just bounced from. The stochastics seem to be aiming for the oversold area, hinting that the pair could keep edging lower. It could head all the way down and reverse upon hitting support at 1.4015. However, if the pair decides to climb higher and break above the 1.5000 handle and go past the resistance at 1.5015, it could take a U-turn upon reaching the pair’s previous week high at 1.5050.
AUDUSD: 1-Hour
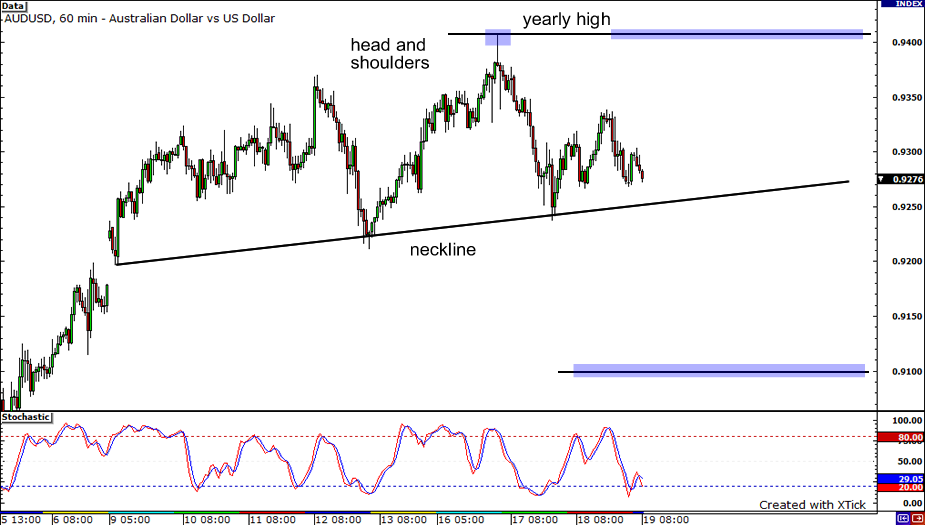
Moving over to the AUDUSD… As you can see, the pair is currently sitting on a very precarious situation given the head and shoulders pattern that it is forming. If the pair breaks down, then the downside target, which is computed by projecting the height of the formation from the point of breakout, would be at 0.9100. If the neckline holds, however, then the pair can range for a while until it moves past the yearly high.


