


EURUSD: 4-Hour

Let’s kick of the week with the currency market’s most liquid pair, the EURUSD. The 4-hour our chart is looking good, showing how divergences work well with support and Fibonacci retracement levels. After forming a bullish divergence (price is making higher lows while stochastics is making lower lows) right smack on the .500 Fib, bulls just kept buying the pair. If the pair continues to bee line north, tough resistance could be found at this year’s high at 1.5000. However, if the rally fizzles out and breaks the .500 Fib, look for potential support at the 0.618 Fibonacci retracement level, around 1.4790-1.4800.
EURJPY: 4-Hour
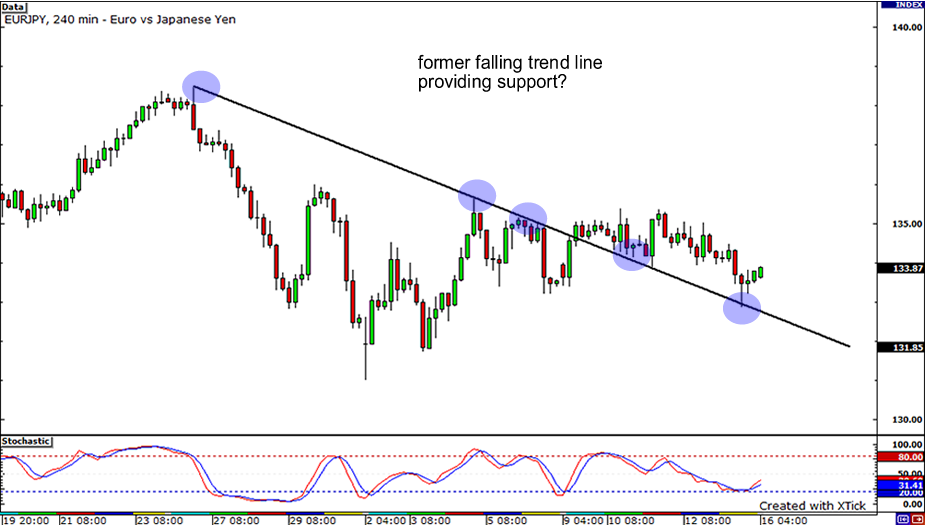
A couple weeks back, I pointed out a falling trend line on the EURJPY. The resistance didn’t hold, as price action broke past it last week. However, the pair is having trouble closing past the 135.00 price mark. In addition, every time price has dipped, it keeps finding refuge at the former falling trend line! With stochastics exiting oversold conditions, we could see buyers come back into play and bring the pair higher to test previous resistance at 135.00. If they succeed, we could see price go as high as 136.00. If however, selling pressure remains, the pair could retest the former trend line once again. If support fails to hold, price could dip to test former lows at 131.80.
EURGBP – 4 hour

Finally, lets end with a cross, the EURGBP! Now, I don’t normally do this pair, but I saw that the pair has been ranging as of late. Support could be seen around 0.8915, while resistance could be found around 0.9060. Will these levels hold this week? Right now, price has bounced off the support line and with stochastic showing oversold conditions, we could see price action bounce back up to the resistance. On the other hand, if sellers come out on top, could we see a break of support?


