


NZDUSD: 1-Hour

It has been a while since I covered the Kiwi. So today I decided to check it out. Here it is… A rounding top can be spotted in NZDUSD’s 1-hour chart. After starting the week on a very encouraging note, the pair fell back and found support at its weekly opening price which is also just around last week’s high. As of writing, this level is still keeping the pair afloat. If this “neckline” breaks, the pair could slide down to 0.7200. On the flip side, it could rise back up towards the area of interest at around 0.7400 if buying interest gets renewed.
USDCAD: 1-Hour

Now, let’s take a look at the USDCAD 1-hour chart… The pair has been trending lower for the past few days but we saw a pullback yesterday as sellers paused to catch their breath. Right now, the pair is sitting atop the 38.2% Fibonacci retracement level. The stochastics are currently in the overbought area and trying to climb their way out, suggesting that the pair could resume its downward movement. Still, the pair could pull back just a little more – probably until the 50% Fibonacci level, which is in line with support turned resistance at the psychological 1.0600 handle. But if the upward movement is not merely a retracement, the pair’s rally could halt at the minor resistance at 1.0670.
EURUSD: 1-Hour
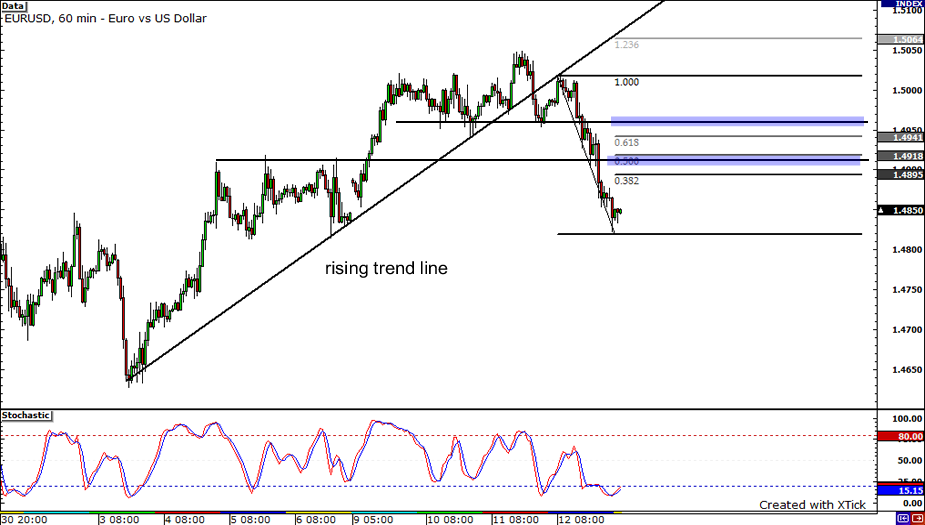
Heading over to the EURUSD 1-hour chart… The EURUSD pair just broke below the rising trend line, signaling that further downward price action could be in the cards. The pair retested this trend line yesterday but was unable to break above it. Currently, the stochastic is in the oversold territory, implying that sellers may have run out of steam. Drawing a Fibonacci tool on yesterday’s down move would show that the 50% retracement level coincides with previous resistance at 1.4915. The pair could retrace all the way to that area or until the 61.8% level, which is 10 pips away from former support at 1.4950.


