


AUDUSD: 1-Hour
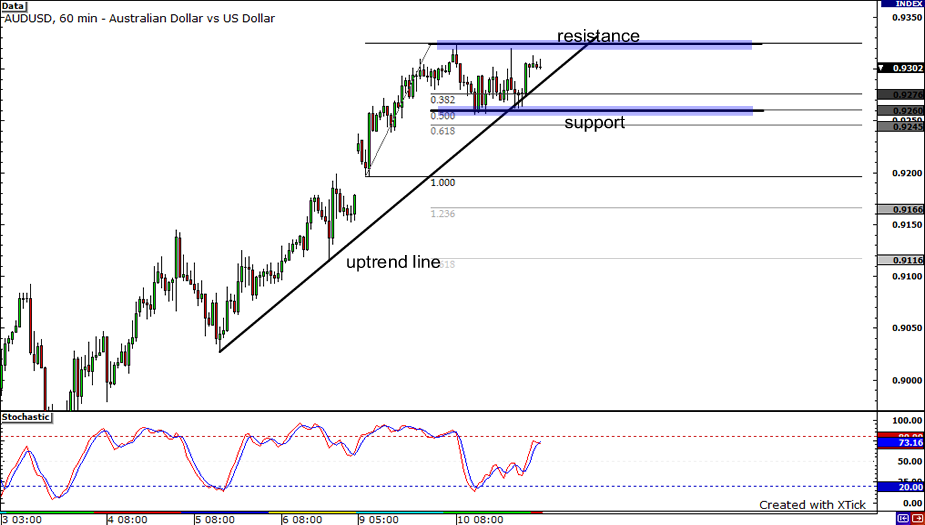
Good morning forex friends! Let’s start today by looking at the AUDUSD’s 1-hour chart. As you can see, the pair fell back to its 50% Fibonacci retracement level after climbing to 0.9324. It can revisit yesterday’s high at 0.9324 if the uptrend support holds, and possibly move even higher if it breaks above the said level. However, if the pair breaks below the rising trendline drawn on the chart, sellers could push the Aussie back to retest the minor support at 0.9260.
EURUSD: 1-Hour

Next is the EURUSD on the 1-hour chart. After breaking free from the 1.4900 resistance, the pair continued to head north where it flirted with the 1.5000 handle once again. Presently, the pair is trading just below the mentioned price level, but it still has an upward bias since the uptrend line is still unbroken. If buyers continue to push the pair north, we may see a break of this year’s high. On the other hand, just like the AUDUSD, if it does break below the rising trendline, we could see a retest of yesterday’s low, minor support around 1.4950.
USDCAD: 1-hour
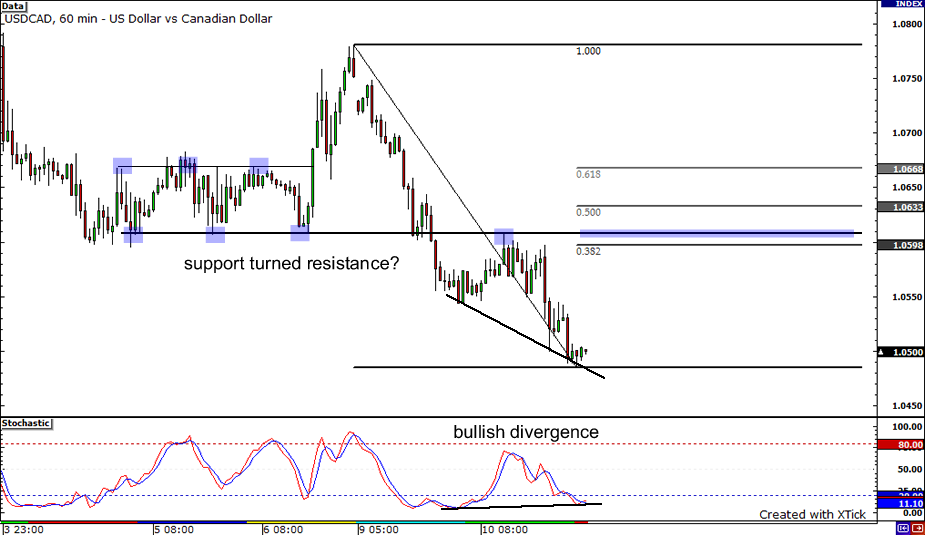
The CAD was one of the strong performers yesterday as the USDCAD dipped to a low of 1.0485. However, the selling pressure seems to be exhausted now that the stochastics are in the oversold area. Bullish divergence, with the price showing lower lows and the oscillator drawing higher lows, also hints that the pair could move higher. Drawing a Fibonacci tool on the latest swing move shows that the 38.2% retracement level is nearly in line with previous support just a few pips above the psychological 1.0600 handle. If that area fails to serve as resistance, the pair could climb but encounter another resistance level at the 61.8% Fibonacci level, which is aligned with previous minor resistance at 1.0668.


