


USDJPY: Daily
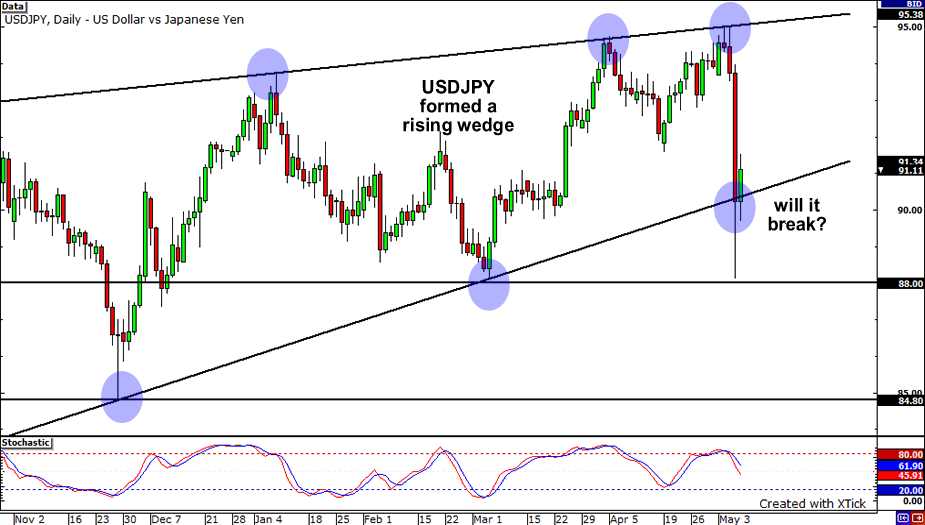
In just one day, the USDJPY found itself falling back to the rising trend line. Still, it looks like the rising wedge is holding, as price only pierced the bottom of the wedge before retracing back in! But for how long will this last? Remember, a rising wedge is a bearish chart pattern that indicates that a a reversal of the overall trend is imminent. In this case, we’re looking for candle close below the ascending trend line to confirm that the trend has indeed reversed to the downside. If that happens, the bears would probably be able to push price to former lows at 88.00 and 85.00, respectively.
NZDUSD: Daily
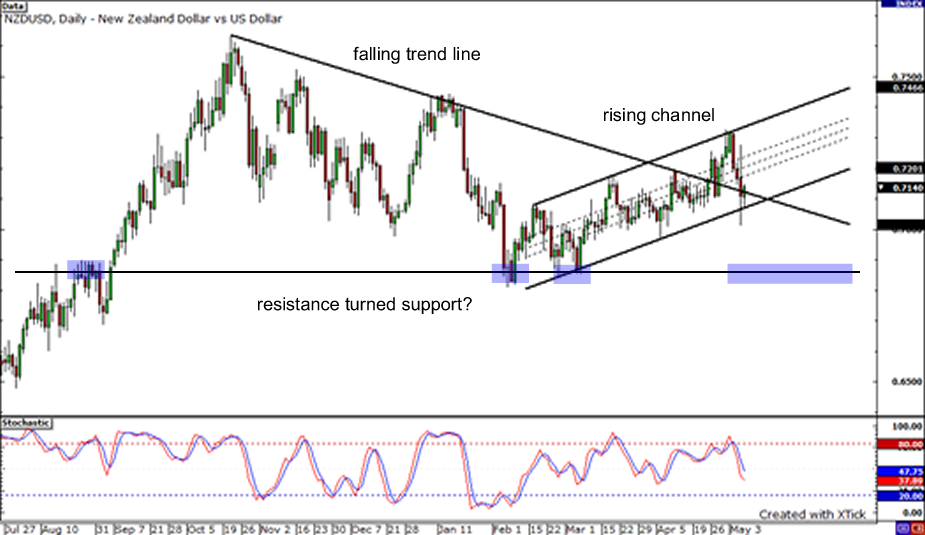
Check out the rising channel on the NZDUSD daily chart. Despite the recent wild moves, it seems to be holding up really well! With the pair hovering at the bottom of the channel, would the support continue to hold or would we see a breakdown? The pair has now dropped back below the falling trend line connecting the pair’s highs and it could keep heading lower. If the pair breaches the bottom of the channel, it could fall until the resistance turned support roughly around the 0.6875 area.
USDCAD: Daily
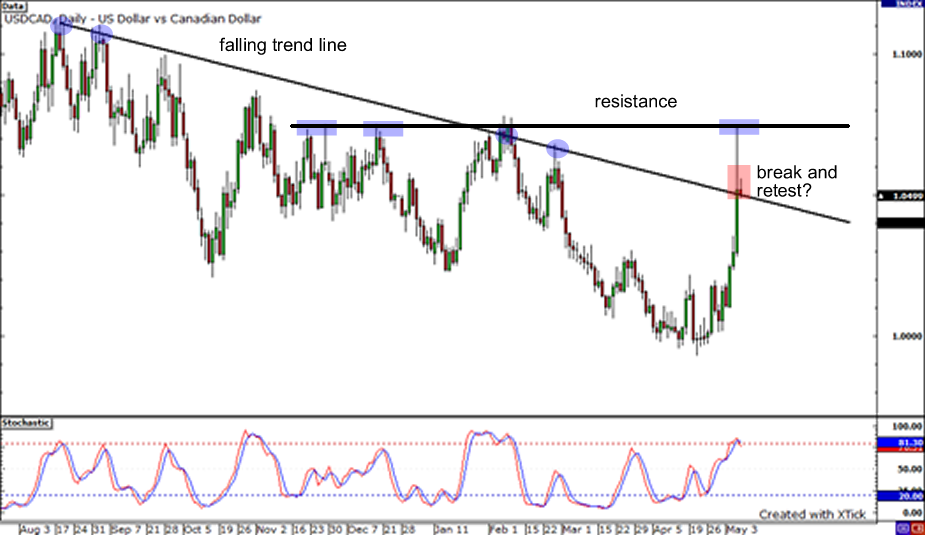
Ooh, that’s a really nasty spike on the USDCAD daily chart! The pair appeared to break above the falling trend line connecting the highs of the price but it soon edged back to the top of the trend line. Are we seeing a retest before the pair climbs higher? If the price bounces from the broken trend line, it could move up until the resistance at yesterday’s high of 1.0750. But if the falling trend line once again serves as resistance for the pair, it could fall back until the 1.0000 handle.


