


EURUSD: 4-Hour
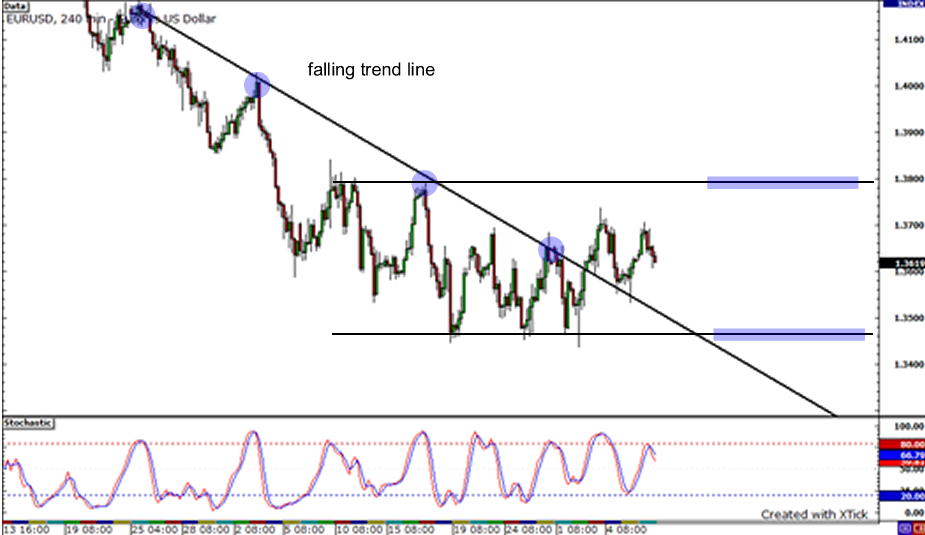
Let’s take a look at the EURUSD 4-hour chart. The pair has been moving under a descending trend line for quite a long while before it finally busted out last week. After pulling back to retest the broken trend line, the pair’s upward movement could carry on. If it breaks above the psychological 1.3700 handle, it could climb all the way up and encounter another resistance level at the 1.3800 mark. On the other hand, if the pair falls back below the trend line, it could tumble down until it finds support at the 1.3450 area.
AUDUSD: 4-Hour

Check out the AUDUSD 4-hour chart I posted above. A rising trend line can be drawn connecting the lows of the pair. Would this trend line stay intact? The pair seems to be pulling back from its recent rally and it could retest the rising trend line right around the 50% Fibonacci retracement level. This coincides with the minor support level around 0.8985. However, the pair is currently sitting at the 0.9065 mark, which served as a former resistance level. If the pair bounces up from this level, it could surge past its recent high of 0.9130.
USDJPY: 4-Hour
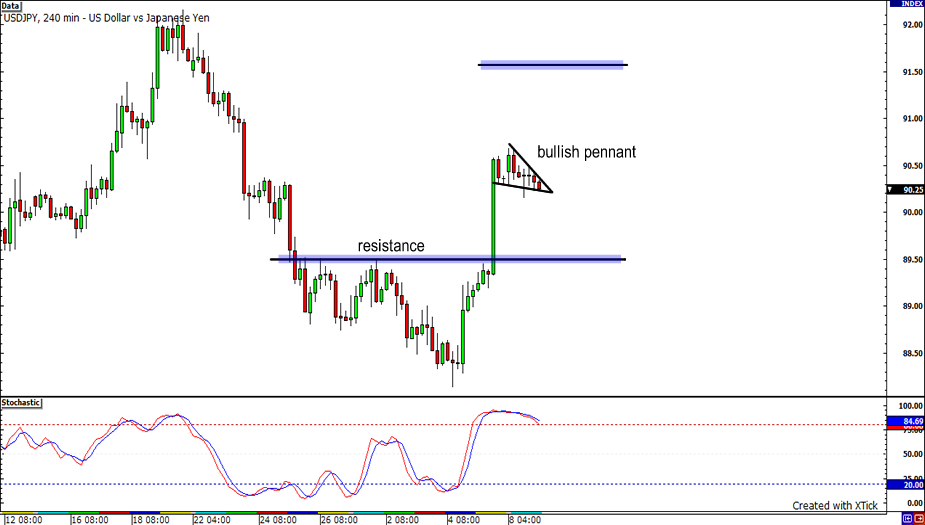
Next is the USDJPY on its 4-hour time frame. As you can see, the pair had pierced right through the 89.50 resistance. Presently, it is forming what appears to be a bullish pennant pattern. Should it break out from this formation, judging from the height of the “pole,” it could possibly reach 91.50. On the other hand, a breakdown could send it right back at 89.50.


