


EURJPY: 4-hour
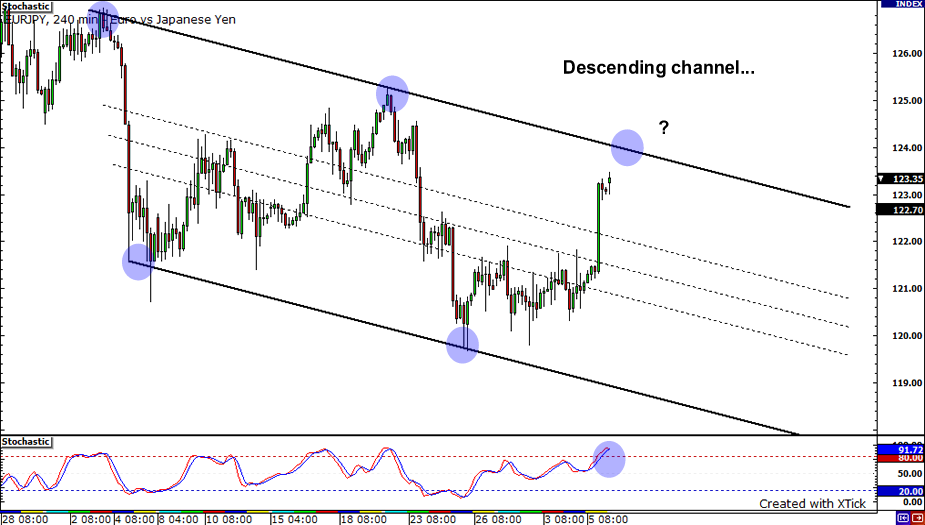
I’m spotting a descending channel formation on the EURJPY 4-hour chart. The pair has been on an extended downtrend since late last year and it could continue to slide down. Stochastics is slowly making its way to overbought territory, suggesting that the move upwards could soon be over. This means that we could see the pair bounce once price hits the top of the channel, somewhere around the 124.00 price region. On the other hand, if a 4-hour candle manages to close above 124.00, a move towards 125.00 is likely.
USDJPY: 4-hour

After bursting past minor resistance at 89.50 and 90.25, the USDJPY has shot up and is now currently sitting near the 90.50 price mark. This just happens to line up with the 61.8% Fibonacci retracement level. With stochastics indicating overbought conditions, we may see sellers jump back in and take price back down to the 89.50 price mark. On the other hand, if buying pressure remains strong, we could see price make a full retracement back up to highs at the 92.00 handle.
GBPJPY: 4-hour
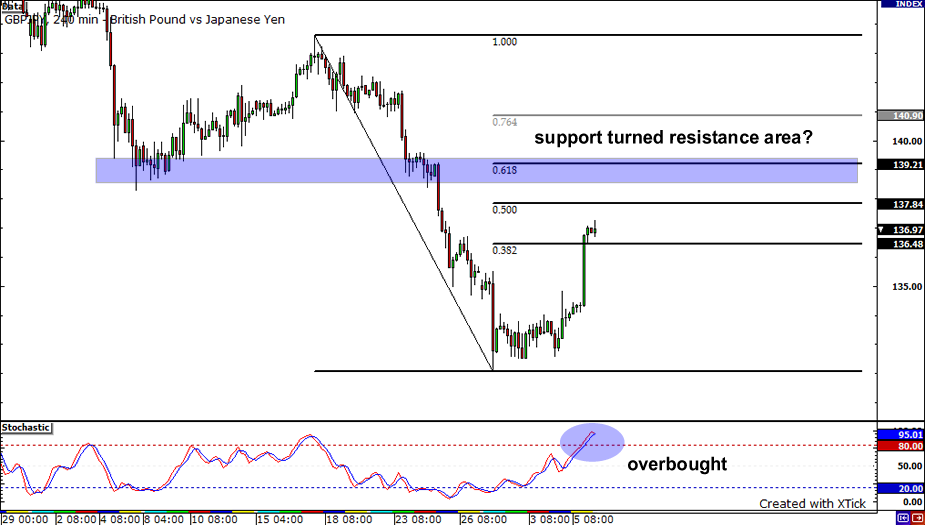
It looks like the GBPJPY is going to head lower too. For one thing, price is heading towards the 61.8% Fibonacci retracement level. Secondly, that Fib level corresponds nicely with the 139.00 region, a a potential support-turned-resistance area. Thirdly, stochastics indicate that conditions are overbought, hinting at a possible move downwards. If we do see price bounce, watch out for a retest 132.00, last week’s low.


