


USDJPY: 4-Hour

Lets kick the month off with an update on USDJPY! As usual, the USDJPY did what it does best – consolidate before busting out! This past week, the pair had consolidated and formed a bullish flag. Unlike the pennant that took 12 days to form before breaking out, this flag got torn to bits after just a few days! Price is currently sitting below major resistance at 93.70, but if buyers take the pair past that point, we could see a strong move all the way up to the 95.00 mark. On the other hand, if price action begins to range again, we could see some support at 92.95, which lines up closely with last week’s highs.
EURJPY: Daily

Next, lets skip on over to the EURJPY. As I’ve pointed out in the past, the EURJPY had been forming a HUGE inverse head and shoulder pattern. The pair finally broke through neckline resistance at 125.00 yesterday, zooming all the way to the 126.50 mark! Will buyers take this pair all the way to 130.00? Or could we see a small retracement first back to the former resistance at 125.00?
GBPJPY: Daily
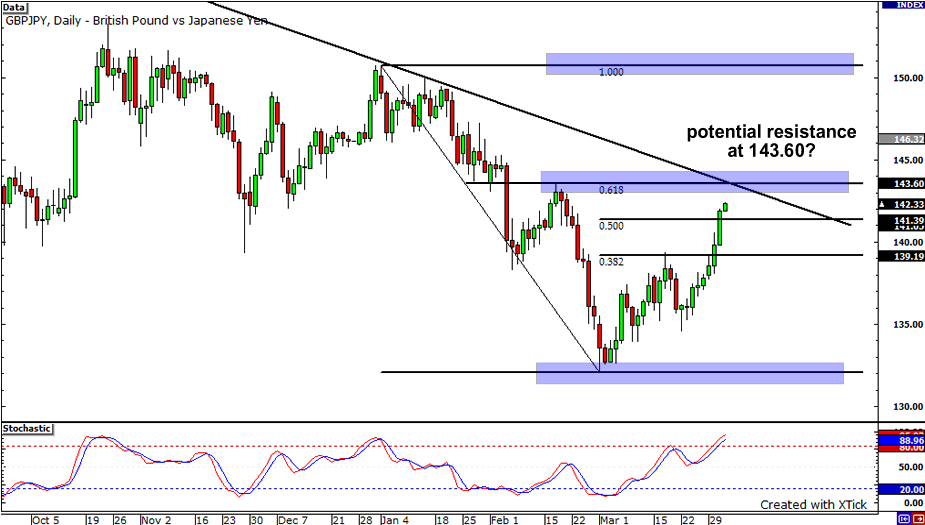
It looks like the GBPJPY has been really rallying strong in the past couple of days, going past through some significant resistance levels. Still, the overall general trend remains downwards as indicated by the falling trend line. With the 61.8% Fibonacci retracement level fast approaching and stochastics heading in to overbought territory, would we see the pair bounce back down? If that does happen, look out for a move towards the previous month’s low towards the 132.20 region. On the other hand, if we see a daily candle close above the falling trend line, the pair could start making its way to 150.00.


